This chapter provides information about the 3dmon program.
A system administrator is often responsible for monitoring the performance of several hosts in a network. To cope with this job, it is desirable to have a monitor that allows the monitoring of selected key statistics on multiple hosts. One such monitor is available in the program 3dmon.
The 3dmon program is an X Window System based program that displays statistics in a 3-dimensional graph where each of the two sides may have up to 24 statistics for a maximum of 576 statistics plotted in a single graph.
The graph layout of 3dmon is that of a chessboard except that each side may have from 1 to 24 fields. The right side always represents a context in the statistics hierarchy. This context may be any context that can have more than one instance of its subcontexts. The currently valid contexts are:
CPU
Disk
FS
FS/*
IP/NetIF
LAN
Mem/Kmem
PagSp
Proc
RTime/ARM
RTime/ARM/*
RTime/LAN
hosts
Note: Not all wildcards are available on systems other than IBM RS/6000 systems.
For each context you want to use, you must supply a list of statistics in the 3dmon configuration file. The list of statistics you specify is used to define a set of statistics (statset). In the configuration file, each set is defined by a wildcard stanza which names the configuration set. When you start 3dmon, you specify which of the defined configuration sets should be used and as 3dmon starts, it displays a list of all instances, which match the wildcard specified in the configuration set. An example of a selection list is shown in the following figure.
3dmon Selection List
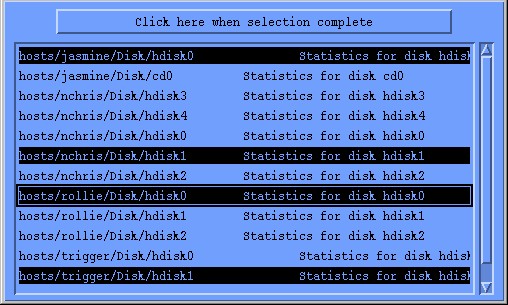
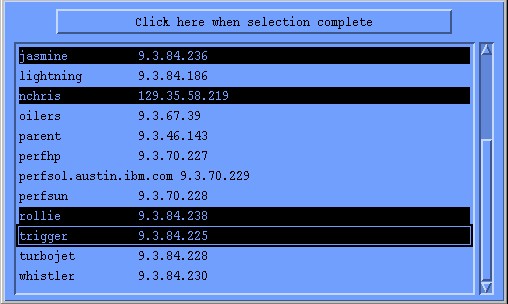
You must then pick the instances you want to monitor. The number of instances you select determines the number of fields on the right side of the "chessboard". For certain configuration sets, you have to first choose from a list of hosts to monitor, then from a list of context instances on the selected hosts. If the selection window in 3dmon Selection List represents the first selection list, then the second could look like the one shown in the Second Level 3dmon Selection List figure below. In this case, the first selection list lets you pick the hosts to monitor and the second shows a complete list of all disks on the selected hosts and lets you select the ones you want to monitor.
Second Level 3dmon Selection List
To select from the lists displayed by 3dmon, move the mouse pointer to the first instance you want, then press the left mouse button and move the mouse while holding the button down. When all instances you want are selected, release the mouse button. If you want to select instances that are not adjacent in the list, press and hold the Ctrl key on the keyboard while you select. When all instances are selected, release the key. After all selections have been made, click with the left mouse button on the button at the top of the window. This will create the 3dmon monitor window. A window created with the selection shown in Second Level 3dmon Selection List is shown in the following figure.
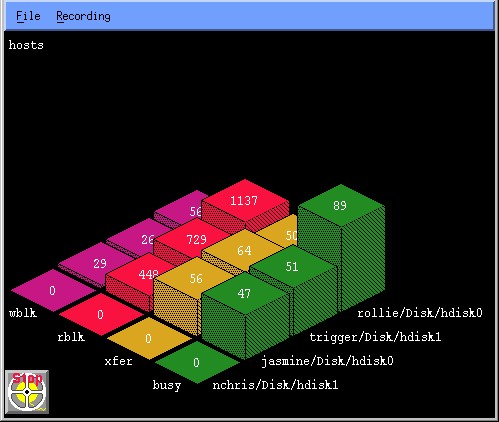
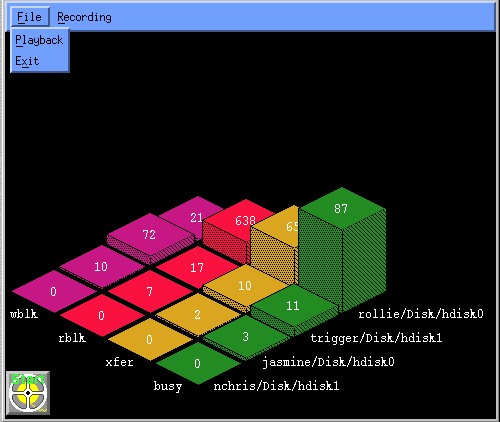
3dmon Graph
The left side of the grid lists the statistics you chose to include in the configuration set. Each must be specified in the configuration file with its full value path name without the part up to and including the primary wildcard. This is explained in detail in Customizing the 3dmon Program .
The third dimension is represented by the actual statistics values as received from the data supplier daemon(s). The values are plotted as rectangular pillars placed on the fields of the chessboard, each filling its field except for a user modifiable spacing between the pillars. The actual value is displayed at the top of each pillar.
The 3dmon graph shows the incoming observations of the values as they are received depending on the type of statistic selected. Statistics can be of type SiCounter or of type SiQuantity:
A user-modifiable color selection is in effect so that each of the statistics represented by the left side of the grid is drawn in a different color.
3dmon File Menu
The File menu of the 3dmon graph window is shown in the preceding figure. Valid selections on the File pulldown menu include:
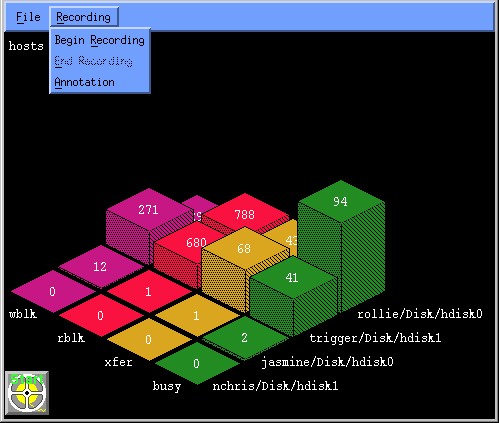
The Recording pulldown menu is shown in 3dmon Recording Menu . Valid selections on the Recording pulldown menu include:
3dmon Recording Menu
In order to determine the height of a "pillar," 3dmon must select a scale. This scale states how many units of the statistic to be drawn correspond to one pixel on the display. The scale is derived from the expected maximum value for the statistic. However, for many statistics it's hard to set a realistic scaling. Because of that, 3dmon attempts to adjust the scale when the drawn pillars would otherwise disappear off the top of the window. This is done as follows:
When, prior to a pillar being drawn, 3dmon sees that the pillar would be more than 10 percent taller than the expected maximum height, an autoscaling function is invoked. The autoscaling function slowly adjusts the scale of a statistic until the scale corresponds to actual measurements. The scale is adjusted by approximately 50 percent each time autoscaling is invoked. Also, autoscaling is always done for all instances of the statistic as represented by a row on the chessboard.
When 3dmon uses the wildcard value hosts, the user selects the hosts to monitor from the initial selection list. If the xmservd daemon on one or more of those hosts dies while 3dmon runs, the program periodically attempts to resynchronize with the host(s). Note that with the Performance Toolbox Local feature, only the local host is available for selection.
Resynchronizing is attempted every 30 seconds if more than 30 seconds have expired since the last data feed was received from a host. The interval between checking if resynchronizing is required can be changed with the command line argument -t.
As 3dmon displays the statistics, high values for statistics in the front part of the grid can obscure the drawing of statistics behind them. You can, at any time, move a row or column to the front by clicking on the name associated with the row or column. When you click on a name at the left side of the grid, the colors of statistics are preserved as the rows of statistics are rearranged.
Another way to see obscured statistics is to reduce the height of the 3dmon window. Because the height of the pillars is calculated from the ratio of window height to window width, decreasing the height reduces the height until, eventually, only the base of the pillar is drawn.
In the lower left corner of the 3dmon window, you see a small icon resembling a tape reel. Initially, this icon has the word "Start" shown in green. When you click on the icon with mouse button 1, recording of the statistics received by 3dmon begins and the text changes to the word "Stop" shown in red. The recording facility is described in Recording from 3dmon .
You can also start and stop recording from the pulldown shown in 3dmon Recording Menu .
The right side of the grid shows the path names of the selections you made from the selection list up to the part that is displayed at the left side of the grid. If all the names at the right side begin with the same string, that string is removed from the names and shown in the upper left corner of the window. This reduces path name lengths and leaves more space to show the graph.
To avoid clashes with X Window System command line options, never leave a blank between a command line option and its argument. For example, do not specify
3dmon -i 1 -p 75 -n
Instead, use:
3dmon -i1 -p75 -n
The 3dmon program takes the following command line arguments, all of which are optional:
3dmon [-vng ] [-f config_file] [-i seconds_interval] [-h hostname] [-w weight_percent] [-s spacing] [-p filter_percent] [-c config] [-a "wildcard_match_list"] [-t resync_timeout] [-d invitation_delay] [-l left_side_tile] [-r right_side_tile] [-m top_tile]
.4 * previous + (1 - .4) * latest
Weight can be specified as any percentage from 0 to 100.
Note: With the Performance Toolbox Local feature, this flag always uses the local host name.
The list of host names must be enclosed in double quotes if it contains more than one host name. Individual host names must be separated by white space or commas.
The primary purpose of this option is to allow the invocation of 3dmon from other programs. For example, you could customize NetView to invoke 3dmon with a list of host names, corresponding to hosts selected in a NetView window.
The default tile number for the left side is 1 (75_foreground).
On some graphics adapters in certain configurations, the 3dmon program might not give you proper tiling. If you notice this, use the following command line arguments to suppress tiling:
3dmon -l0 -r0 -m0
Use the flags shown in addition to any other flags you may require. You can substitute the digit 4 for any of the zeroes shown above. The digit 0 means to paint the pillar in the foreground color; the digit 4 means to paint it in the backgound color.
To exit the 3dmon program, select Exit from the pulldown shown in 3dmon File Menu or close the program's window with the window manager. In case of the mwm window manager, click in the upper left corner of the window frame, then select the Close option from the menu.
The 3dmon program requires a configuration file to describe the set of statistics (statsets) to display. A configuration file can be specified with the -f command line argument. If it is not, 3dmon first looks for the file 3dmon.cf in your home directory. If no such file is found, the file is searched for as described in Overview of File Placement .
The configuration file may have comment lines beginning with the character # (number sign). It can contain multiple configuration sets, each of which must begin with a wildcard stanza. The wildcard stanza must have one or two arguments. The last argument must be a valid context name. Configuration sets can be constructed as single wildcard sets or dual wildcard sets. Single wildcard sets present only one selection list to the user, while dual wildcard sets require the user to select from two lists before 3dmon begins to display statistics.
If the command line argument -c is not used to override the default, the first configuration set in the configuration file is chosen by 3dmon. Otherwise the set named by the -c argument is chosen. If no set in the configuration file matches the -c argument, 3dmon terminates with an error message.
The following is an example of a definition of a configuration set where only one argument is provided on the wildcard stanza. The argument is hosts, and is used both to identify the configuration set and to specify the wildcard context:
wildcard: hosts
If two arguments are supplied with the wildcard stanza, the first identifies the configuration set. This name is used to match any name passed with the command line argument -c. The second argument must be the name of the wildcard context.
The remaining lines of a set must each specify a statistic, which is valid for the given wildcard. A set is terminated when another wildcard stanza is met or at end of file. The following example shows statistics defined for the wildcard hosts:
wildcard:        hosts     # remote hosts
Mem/Virt/steal
PagSp/pgspgout
PagSp/pgspgin
Proc/swpque
Proc/runque
PagSp/%totalused
Syscall/total
SysIO/writech
SysIO/readch
Notice how the full path name is specified except for the wildcard part. The resulting path name for the instance (host name) birte for the first statistic would be hosts/birte/Mem/Virt/steal .
If you want more than one configuration set that uses the hosts wildcard, enter two arguments on the wildcard line:
wildcard:      nodecpu    hosts
CPU/cpu0/user
CPU/cpu0/kern
CPU/cpu0/wait
CPU/cpu0/idle
The above configuration set would be activated by the command line:
3dmon -cnodecpu
For process statistics, the statistic path name includes the name of the process context, which is constructed from the process ID, a ~ (tilde), and the name of the executing program. To reach a specific process, you can add a line that specifies either the process ID followed by the ~ (tilde), or the name of the executing program. The example below shows how to specify a statistic for the wait pseudo process, which (on AIX UPs) always has a process ID of 516. Both lines point to the same statistic.
Proc/516~/usercpu
Proc/wait/usercpu
If you specify a name of a program currently executing in more than one process, only the first one encountered is found.
The distributed sample configuration file for 3dmon defines two single wildcard configuration sets for the hosts wildcard. One (the default) is called hosts. The other is called 24 because it shows 24 statistics for each host selected.
To monitor selected statistics for processes, the configuration file might contain:
wildcard: Proc
usercpu
kerncpu
workmem
pagsp
The above configuration set would cause 3dmon to present you with a list of all processes in the host.
Two contexts are special because they themselves may exist in multiple instances and have subcontexts that may also exist in multiple instances. One of these contexts describes file systems and is named FS. To allow 3dmon to find all instances in both context levels, you can begin a statistics line with the wildcard character * (asterisk). While, strictly speaking, this is a use of dual wildcards, it is described here because it, unlike other dual wildcard configuration sets, presents you with only one selection list. The use of the asterisk in a path name is used in the supplied configuration set shown below:
wildcard: FS
*/%totfree
*/size
ppsize
free
The statistics %totfree and size exist for every logical volume, while the remaining two exist for every volume group. In a system with two volume groups and a total of five logical volumes, this would yield five columns (right side of graph) and four rows (left side of graph). For example, the right side might show:
rootvg/hd4
rootvg/hd9var
rootvg/hd3
rootvg/hd1
newvg/hd10
The left side would show the four statistic names. Note that because the ppsize and free statistics are at the volume group level, they are identical across all four columns that are derived from rootvg.
The supplied configuration file contains the following single wildcard configuration sets:
wildcard: hosts           # remote hosts
wildcard: 24 hosts        # remote hosts, large set
wildcard: Disk            # local disks
wildcard: Kmem  Mem/Kmem  # local kernel memory
wildcard: Proc            # local processes
wildcard: LAN             # local lan adapters
wildcard: FS              # local file systems
wildcard: IP/NetIF        # local IP interfaces
wildcard: CPU             # local processors
wildcard: RTime/ARM       # local application response time
wildcard: lanresp hosts   # response time between multiple hosts
The configuration set "lanresp" for response time between multiple hosts is special because it will have identical labels on the left and right side of the grid. It uses the top context RTime/LAN , which always creates this type of graph and thus allows only a single metric to be specified. This is describes in more detail in Monitoring IP Response Time from 3dmon .
If a configuration set begins with a wildcard stanza that defines the wildcard as hosts, then the path names of the statistics belonging to that set may contain one or more asterisks in place of contexts that may exist in more than one instance. This is shown in the supplied configuration set called proc:
wildcard: proc hosts # processes on remote hosts
Proc/*/usercpu
Proc/*/kerncpu
Proc/*/workmem
Proc/*/codemem
Proc/*/pagsp
Proc/*/majflt
Proc/*/minflt
When you invoke 3dmon to use this configuration set, you are presented first with a list of all matches of the primary wildcard, which is the list of hosts that responded to invitation. After you select the hosts you want to monitor, you are shown a list of all processes on those hosts. To proceed, select the processes you want to monitor. If you select more than 3dmon can show, excess instances are ignored.
If you use the command line argument -a to specify a list of host names, the first selection list is not shown. Rather, all responding hosts that match a name in the -a list are automatically selected.
Another example of a dual wildcard configuration set is shown below:
wildcard: fs hosts # remote file systems
FS/*/*/%totfree LV
FS/*/*/size     LV
FS/*/ppsize     VG
FS/*/free       VG
FS/iget         FS
This time the statistics are at different levels so that the first two are logical volume statistics, the next two are volume group statistics, and the last one is a statistic directly under the FS context. To show this in the final graph, a suffix is specified after the name of each statistic. The first word of such a suffix is suffixed to the statistic name on the graph. Its only purpose is to show you the levels of the statistics in the graph.
The third example of a dual wildcard configuration set is the following set to create a 3dmon graph to monitor application response time and activity:
wildcard:  armresp hosts # application response time
RTime/ARM/*/*/resptime
RTime/ARM/*/*/respavg
RTime/ARM/*/*/respmax
RTime/ARM/*/*/respmin
RTime/ARM/*/*/good
RTime/ARM/*/*/aborted
RTime/ARM/*/*/failed
When one or more lines have the wildcard character * (asterisk), all lines in that configuration set must either be without wildcards or match the same pattern of wildcards. It would be invalid to specify the following two metrics under the same wildcard:
FS/*/*/%totfree
Proc/*/usercpu
3dmon warns about such errors in the configuration file and ignores the offending lines.
The supplied configuration file contains the following dual wildcard configuration sets:
wildcard: disk hosts     # disks on remote hosts
wildcard: kmem hosts     # kernel memory on remote hosts
wildcard: proc hosts     # processes on remote hosts
wildcard: lan hosts      # LAN adapters on remote hosts
wildcard: fs hosts       # file systems on remote hosts
wildcard: ip hosts       # IP interfaces on remote hosts
wildcard: cpu hosts      # Processors on remote hosts
wildcard: armresp hosts  # application response time
The 3dmon program uses the RSi application programming interface throughout. This means that to locate potential data supplier hosts it uses the RSiInvite function call. This function relies on the file $HOME/Rsi.hosts to specify the rules for broadcasting are_you_there messages. (See Overview of File Placement for alternative locations of the Rsi.hosts file).
If the file does not exist, broadcasting is done only to hosts on the same subnet as defined for the network adapters in the host where 3dmon runs. For details about the $HOME/Rsi.hosts file, refer to How Data-Suppliers are Identified .
The X Window System resource file for 3dmon defines resources you can use to enhance the appearance of 3dmon and is installed as /usr/lib/X11/app-defaults/3Dmon .
X Window System Resources for 3dmon lists the defined resources for 3dmon.
The sample file first defines the font to use. The resource name to define the font specifically for 3dmon is GraphFont. If you don't define this resource, 3dmon tries to get a font name from the following resources:
If none are defined, a suitable fixed-pitch font is used.
The next two lines define the foreground and background colors of the graph area. Finally, 24 lines define the default colors for the up to 24 statistics that can be plotted. The colors shown in "Figure 3. X Window System Resources for 3dmon" are the default colors. Only if you do not like the defaults do you need to modify the ValueColorxx resources.
  #
  #    3dmon  options
  #
  *GraphFont:
-ibm-block-medium-r-normal--15-100-100-100-c-70-iso8859-1
  *DrawArea.background:  black
  *DrawArea.foreground:  white
  *ValueColor1:   ForestGreen
  *ValueColor2:   goldenrod
  *ValueColor3:   red
  *ValueColor4:   MediumVioletRed
  *ValueColor5:   LightSteelBlue
  *ValueColor6:   SlateBlue
  *ValueColor7:   green
  *ValueColor8:   yellow
  *ValueColor9:   BlueViolet
  *ValueColor10:  SkyBlue
  *ValueColor11:  pink
  *ValueColor12:  GreenYellow
  *ValueColor13:  SandyBrown
  *ValueColor14:  OrangeRed
  *ValueColor15:  plum
  *ValueColor16:  MediumTurquoise
  *ValueColor17:  LimeGreen
  *ValueColor18:  khaki
  *ValueColor19:  coral
  *ValueColor20:  magenta
  *ValueColor21:  turquoise
  *ValueColor22:  salmon
  *ValueColor23:  white
  *ValueColor24:  blue
X Window System Resources for 3dmon
The icon shown in the lower left corner of the 3dmon window controls recording of the observations received by 3dmon. Initially, this icon has the word "Start" shown in green. When you click on the icon with mouse button 1, recording to a disk file of the statistics received by 3dmon begins and the text changes to the word "Stop" shown in red.
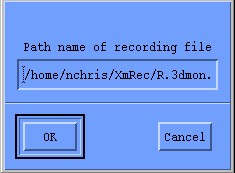
3dmon Recording File Name
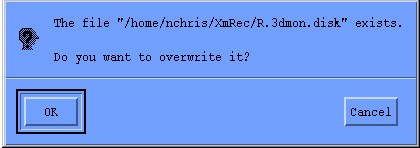
The first time you click on the icon, the window shown in the preceding figure pops open and prompts you to select a file name for the recording file. The window has a default file name constructed from the path name of the xmperf recording directory $HOME/XmRec followed by R.3dmon.set , where the part following the last period is the name of the configuration set you are using. Change the name, if required, and then click on the OK button to start the recording. If the name you select exists, the window shown in the following figure allows you to either overwrite the file or select a different name.
3dmon Existing File Dialog
After recording has been started, it can be stopped and restarted by clicking on the icon. Whenever recording is active, the icon shows the word "Stop" in red. After you stop recording, the recording file is kept open by 3dmon to allow quick resumption of the recording without going through the prompting for a recording file name. The recording file is closed when 3dmon exits. You can also start and stop recording from the 3dmon Recording pull-down menu.
Recordings produced by 3dmon defines sets of statistics (statsets) for each selection you did from the selection list (one for each name at the right side of the grid). The value records in the recording file correspond to sets of statistics (statsets).All 3dmon recordings can be played back by xmperf but they lack a console definition and therefore use the default playback console format described in Creation of Playback Consoles .
3dmon recordings can also be played back by 3dplay.
Recordings produced by 3dmon can be analyzed by the azizo program and processed by the recording support programs.