[ Previous |
Next |
Contents |
Glossary |
Search ]
Performance Toolbox Version 1.2 and 2 for AIX: Guide and Reference
Chapter 3. The xmperf User Interface
This chapter provides information about the xmperf user
interface.
The xmperf User Interface Overview
The xmperf program has one main window which is
displayed when you start the program. The main window
provides you with the interface to functions that are not
related to active consoles. In addition to the main window,
one or more consoles might be displayed when you start xmperf.
This happens if you have defined one or more default consoles
in your configuration file. If no default console is defined,
initially only the main window is displayed. When default
consoles are defined, they are opened in the same sequence as
they appear in the configuration file. See
Defining Default
Consoles
for further information.
The xmperf Command Line
The general format of the xmperf command line is:
xmperf [-v auxz] [-w width] [-o
options_file] [-p weight] [-h
localhostname]
[-r network_timeout]
All command line options are optional and all except -r
and -h correspond to X Window System resources that
can be used in place of the command line arguments. The
options v, a, u, x, and z
are true or false options. If one of those options is set
through an X Window System resource, it can not be overridden
by the corresponding command line argument. The options are
described as follows:
- v
- Verbose. This option prints the configuration file
lines to the xmperf log file
$HOME/xmperf.log
as they are processed. Any errors detected for a line
will be printed immediately below the line. The
option is intended as a help to find and correct
errors in a configuration file. Use the option if you
don't understand why a line in your configuration
file does not have the expected effect.
Setting
the X Window System resource
BeVerbose
to true has the same effect as this flag.
- a
- Adjust size of the value path name that is displayed
in instruments to what is required for the longest
path name in each instrument. The length can be less
than the default fixed length (or the length
specified by the -w option if used) but never
longer. The use of this option can result in consoles
where the time scales are not aligned from one
instrument to the next.
Note: For pie chart graphs, adjustment
is always done, regardless of this command line
argument.
Setting the X Window System resource
LegendAdjust
to true has the same effect as this flag.
- u
- Use popup menus. As described in
Console Windows
,
the overall menu structure can be based upon pulldown
menus (which is the default) or popup menus as
activated with this flag. Typically, pulldown menus
are easier to understand for occasional users; while
popup menus provide a faster, but less intuitive
interface.
Setting the X Window System resource
PopupMenus
to true has the same effect as this flag.
- x
- Subscribe to exception packets from remote hosts.
This option makes xmperf inform all the remote
hosts it identifies that they should forward
exception packets produced by the filtd
daemon, if the daemon is running. If this flag is
omitted, xmperf will not subscribe to
exception packets.
Setting the X Window System
resource GetExceptions
to true has the same effect as this flag.
- z
- For monochrome displays and X stations, you might
want to try the -z option, which causes xmperf
to draw graphical output directly to the display
rather than always redrawing from a pixmap. By
default, xmperf first draws graphical output
to a pixmap and then, when all changes are done,
moves the pixmap to the display. Generally, with a
locally-attached color display, performance is better
when graphical output is redrawn from pixmaps. Also,
a flaw in some levels of X Window System can be
bypassed when this option is in effect.
Setting
the X Window System resource
DirectDraw
to true has the same effect as this flag.
- w
- Must be followed by a number between 8 and 32 to
define the number of characters from the value path
name to display in instruments. The default number of
characters is 12.
Alternatively, the legend width
can be set through the X Window System resource
LegendWidth
.
- o
- Must be followed by a file name of a configuration
file (environment) to be used in this execution of xmperf.
If this option is omitted, the configuration file
name is assumed to be $HOME/xmperf.cf
.
If this file is not found, the file is searched for
as described in Overview
of File Placement
.
Alternatively, the
configuration file name can be set through the X
Window System resource
ConfigFile
.
- p
- If given, this flag must be followed by a number in
the range 25-100. When specified, this flag turns on
"averaging" or "weighting" of all
observations for state graphs before they are
plotted. The number is taken as the "weight
percentage" to use when averaging the values
plotted in state graphs. The formula used to
calculate the average is:
val = new * weight/100 +
old * (100-weight) / 100
where:
- val
- Is the value used to plot.
- new
- Is the latest observation value.
- old
- Is the val calculated for the previous
observation.
- weight
- Is the weight specified by the -p
flag. If a number outside the valid range is
specified, a value of 50 is used. If this
flag is omitted, averaging is not used.
Alternatively, the averaging weight can be set
through the X Window System resource
Averaging
.
The weight also controls the calculation of
weighted average in tabulating windows.
- h
- Must be followed by the host name of a remote host
that is to be regarded as Localhost. The Localhost
is used to qualify all value path names that do not
have a host name specified. If not specified, Localhost
defaults to the host where xmperf executes.
Note:
With the Performance Toolbox Local feature, this
flag always uses the local host name.
- r
- Specifies the timeout (in milliseconds) used when
waiting for responses from remote hosts. The value
specified must be between 5 and 10,000. If not
specified, this value defaults to 100 milliseconds.
Note: On networks that extend over
several routers, gateways, or bridges, the
default value is likely to be too low.
One indication of a too low timeout value is when
the list of hosts displayed by xmperf contains
many host names that are followed by two asterisks.
The two asterisks indicate that the host did not
respond to xmperf broadcasts within the
expected timeout period. The
Host Selection List
from xmperf
shows how some
hosts in a host
selection list have asterisks. The list shown was
generated in a network with multiple levels of
routers where the default timeout is on the low side
during busy hours.
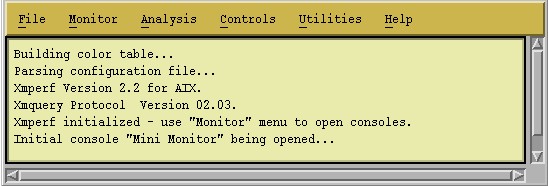
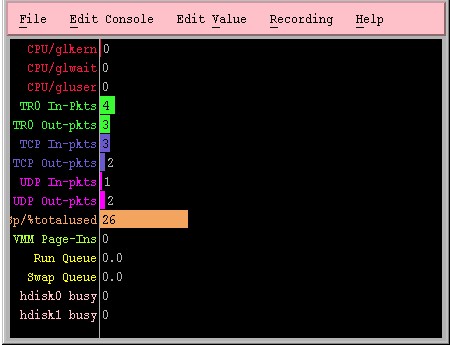
The xmperf Main Window
The xmperf main window is shown in the following figure. At the top of
the main window is
a menu bar. The menu bar provides access to six pulldown
menus. The remainder of the window displays messages from xmperf
as necessary. Message lines in the main window can be
scrolled horizontally if they are longer than the window is
wide, and you can scroll vertically to see previous message
lines. The messages you see could be:
- Information messages
- Messages from xmperf during startup and about
commands executed from one of the menus described
below, including the exact command line the system
attempted to execute.
-
- Error messages
- Messages telling you about errors that could not be
detected during startup.
-
- Exception messages
- Exceptions received from data suppliers.
The xmperf Main Window
The menu bar of the main window provides major ways to
control xmperf. It has the following pulldown menus:
- File
- The CUA prescribed File menu.
-
- Monitor
- The menu from where you open and close consoles,
instantiate skeleton consoles, and create new
consoles.
-
- Analysis
- One of three "tools" menus from where
commands can be executed. The menu is customizable
and is intended to be used for analytical tools.
-
- Controls
- The second of three "tools" menus from
where commands can be executed. This menu has a fixed
menu item that creates a list of processes in the
local system. The rest of the menu is fully
customizable and is intended to be used for commands
that influence, or control, the performance of your
system.
-
- Utilities
- The last of three "tools" menus from where
commands can be executed. This menu has a fixed menu
item to create a list of processes on a remote host
that you must select from a pulldown menu. The rest
of the menu is fully customizable and is intended to
be used for miscellaneous tools and commands.
-
- Help
- The Help menu.
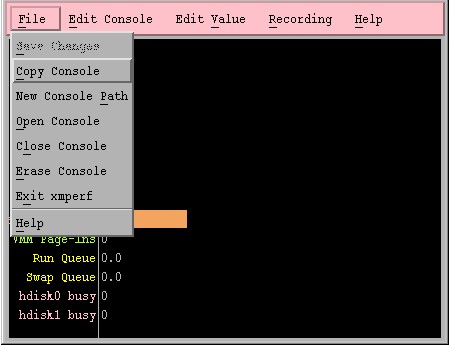
The File Menu
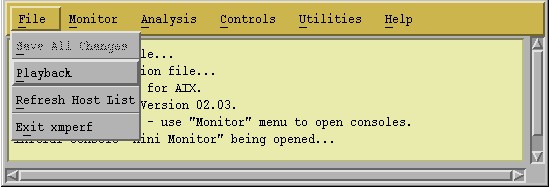
The xmperf File Menu
The xmperf File menu, as shown in the preceding figure, has
the following items:
- Save All Changes
- When you you select this menu item, all changes to
all consoles are written to the configuration file.
The only exceptions are changes to instances of
skeleton consoles. Changes to instantiated skeleton
consoles are never written to the configuration file,
because such consoles don't belong in the file.
After
all changes are saved, the menu selection is
inactivated and can not be selected until new changes
are made to at least one console.
- Playback
- This menu selection starts the playback feature
described in Recording
and Playback with xmperf
.
-
- Refresh Host List
- Normally, the remote interface makes sure you have an
updated list of remote hosts to select from when you
instantiate a remote skeleton console or create a
list of processes on a remote host. This automatic
refresh is done once every five minutes. The Refresh
Host List menu item allows you to initiate a
refresh whenever you like.
-
- Exit xmperf
- Selecting this item terminates the entire xmperf
application, but not before a couple of checks are
done:
- The program
checks whether any changes have been made to
any console since the last saving to the
configuration file. If so, a small dialog box
is displayed, giving you the choice between
discarding the changes or saving them to the
configuration file.
- The program
checks if any consoles are still active. If
this is the case, you are asked if you want
to exit while consoles are active. This is
just a precaution to prevent accidental
exiting of the program when valuable historic
data is accumulated in an active console. You
can choose to exit or not.
Note: An attempt to close the
main window from the window manager has
the same effect as selecting Exit
xmperf from the File menu.
The Monitor Menu
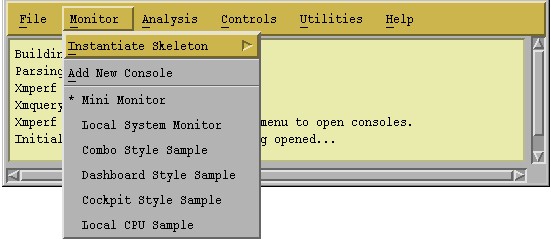
The xmperf Monitor Menu
The Monitor menu, illustrated above, has four menu items, one of which is
representing a
submenu:
- Instantiate Skeleton
- Represents a submenu containing all the skeleton
consoles defined in the configuration file. To
instantiate a particular skeleton console, click on
it with the left mouse button. Notice that the
skeleton console names are preceded by the letter
"S". For information on how skeleton
consoles work, see Skeleton
Consoles .
-
- Add New Console
- Choose this selection if you want to build a new
console interactively from scratch. Details on this
selection are provided in
Creating a
Console .
-
- Ordinary Consoles
- Consoles defined in the configuration file or created
interactively are each represented by one menu
selection. When a console is active, the name of the
console is preceded by an asterisk. To activate
(open) a console, click on one with no asterisk; to
deactivate (close) a console, click on one with an
asterisk. Observe that when you close a console, all
historic data accumulated in any instrument of that
console is lost and the recording of data is stopped.
-
- Instantiated Skeleton Consoles
- These consoles also appear in the Monitor menu. When
a skeleton console is selected from the
"Instantiate Skeleton" submenu, an instance
of that skeleton is created and activated (opened).
This causes it to appear in the Monitor menu with an
asterisk. From this point, the instance works exactly
as an ordinary console except that the changes you
make to the instance are not saved to the
configuration file.
The Tools Menus
The Tools menus are described in detail in
The xmperf Command Menu
Interface
.
Briefly, they allow you to execute
commands from within the xmperf application with an
easy way to fill-in command line arguments. Commands are
defined in the configuration file.
The Help Menu
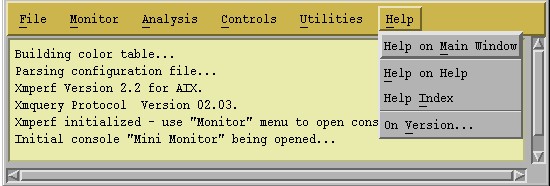
The xmperf Main Help Menu
This pulldown menu has four menu items:
- Help on Main Window
- Displays any help text supplied in the simple help
file and identified by the name Main Window.
-
- Help on Help
- Displays any help text supplied in the simple help
file and identified by the name Help on Help.
-
- Help Index
- Opens a Help Index window with a list of help topics.
To display the help screen for a help topic, click on
the corresponding line in the help index window.
-
- On Version...
- Displays an information window that states the xmperf
version in use.
Console Windows
To give you full flexibility, consoles can be opened and
closed from menus associated with each console as well as
from the main window. Equally important, consoles can be
configured interactively from the same menus. This
necessitates a rather intricate system of menus, which within
the CUA specifications can be created as either pulldown or
popup menus.
By default, xmperf is configured with pulldown
menus. If you want popup menus, use the command line argument
-u or set the X Window System resource
PopupMenus to
true. Command line arguments are described in
The xmperf Command Line
and supported resources in The
xmperf Resource File .
Console Pulldown Menus
When xmperf is configured with pulldown menus, each
console has its own menu bar. As shown in the following
figure, the menu bar has five pulldown menus:
- File
- The CUA prescribed File menu.
-
- Edit Console
- A menu used to customize the console and the
instruments it contains but not individual values.
-
- Edit Value
- A menu for customizing individual values to be
plotted by the console's instruments.
-
- Recording
- The menu used to start and stop recording from a
console or one or more of its instruments.
-
- Help
- The Help menu for the console.
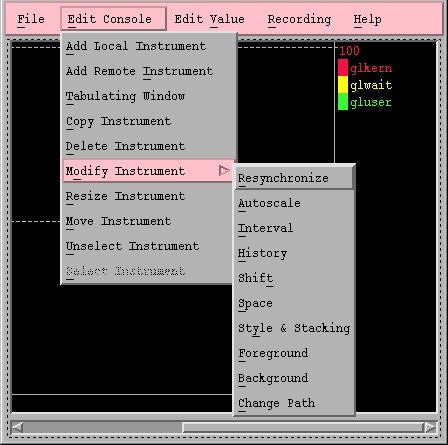
An xmperf Console with Pulldown Menu
Most of the choices from the Edit Console and Edit Value
menus require that you specify which of the instruments in
the console you want to work with. Because of this, those
menu items are ghosted or "grayed out" (inactive)
until you have selected an instrument.
When an instrument is selected, xmperf attempts to
draw a dashed line around it. This is only possible if there
is space between the instrument and neighboring instruments
or the console border. In most cases, you can see at least
some of the dashed line, but if you want to always be able to
see it, just make sure that instruments never touch each
other or the border of the containing console. An example of
a selected instrument is shown in The
xmperf Edit Console Menu figure.
Once an instrument is selected, the otherwise inactive
menu items in the Edit Console and Edit Value pulldown menus
become active and any selection you make applies to the
instrument you selected.
The Console File Menu
The File menu of a console with pulldown menu is shown in
the following figure. It contains functions that apply to the
console or to the xmperf application as a whole. The
menu items are:
The xmperf Console File Menu
- Save Changes
- When the console has not been modified by you, or
when such modifications have already been saved
previously, this menu selection is inactive so you
can't select it. When you make a change to the
console, this menu selection becomes active.
When
you select this menu item, all changes to the console
(but not to other consoles) are written to the
configuration file. After the changes are saved, this
menu selection is inactivated until new changes are
made to the console.
- Copy Console
- When you select this option, a new console is made as
an exact copy of the current console. First, a dialog
box prompts you for a name for the new console. You
enter the name of your choice as described in
Choosing a Name
. All the
rest is done automatically.
-
- New Console Path
- This menu item gives you the possibility to
"remount" all the instruments in the
console on a different host. The name of the menu
item means that you replace the hosts part of
the path names of all values in the console with a
new host name. For example, assume a console has two
instruments, one monitoring statistics on host umbra
and the other monitoring statistics on host bamse.
By selecting a new host name, such as buzzer,
you cause both instruments to be monitoring buzzer.
The new host name is selected from a popup list of
host names containing all the currently available
data-supplier hosts. From this list you pick the one
you want by clicking on it and then clicking on the Done
menu in the menu bar of the box. This produces a
small pulldown menu. If you click on the Cancel
menu item, the box goes away and no new path is
selected. If you click on the Reselect menu
item, the list of data-supplier hosts is refreshed.
If you click on the Accept Selection menu
item, the selected host is chosen as the remote host
for all statistics in the console.
Note: With the Performance Toolbox Local
feature, only the local host is available for
selection.
As the instruments are changed to monitor the new
host, some may reference statistics that are not
available on the new host. Such statistics disappear
from the changed instrument. Similarly, an instrument
can contain referenced statistics that were not
available on the previous host but exist on the new
host. Such statistics are added to the instrument.
- Open Console
- This selection produces a popup menu containing all
the consoles defined. The popup menu contains all the
consoles in the Monitor menu of the main window and
its submenu of skeleton consoles. It is placed here
to allow you total control even without having the
main window visible.
-
- Close Console
- When you select this item, the current console is
closed and all historic data collected for its
instruments is lost. If recording was active for the
console or any of its instruments, recording stops
and the recording file is closed. You can get the
same effect by selecting the console from the Monitor
menu of the main window or from the Open Console
menu. Of course, since the console is active, its
name is preceded by an asterisk in the menus, so
selecting it deactivates (closes) the console. An
alternative way of closing the console is to select
the Close option from the Window Manager menu
of the console window.
-
- Erase Console
- Selecting this item erases the console definition
from the Monitor menu (and from the configuration
file if and when the changes are saved). Before the
console is erased the actions described for the Close Console selection are carried out. To make
sure you don't do this accidentally, you are prompted
to verify the selection before it is carried out.
-
- Exit xmperf
- This item works exactly like the Exit xmperf
selection of the File menu in the main window. It is
placed here to allow you total control even when the
main window is minimized.
-
- Help
- This item contains three menu lines. The first menu
line provides you with the intended use of the
console and related other consoles and tools. Help
for the console is shown if the simple help file (see
Simple Help
File Format
) is present and contains a help
screen for the console. The second takes you to the
help index, and the last is the prescribed On
Version to display a short message informing you
of the version of xmperf.
The Help
menu item in the File menu is a duplicate of the Help
menu item in the console menu bar.
The Edit Console Menu
The Edit Console pulldown menu has ten items, as shown in
the figure below.
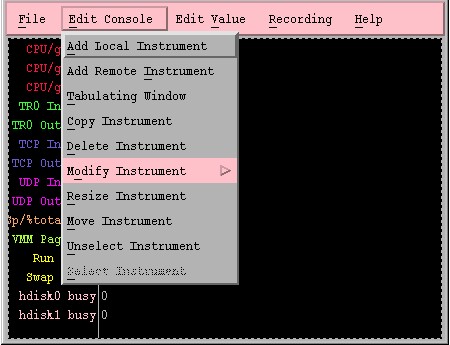
The xmperf Edit Console Menu
The first two are always active, the last one is active
only when no instrument is selected, and the remaining seven
items are active only when an instrument is selected. The
menu items are:
- Add Local Instrument
- Selecting this menu item causes the console to be
prepared for the addition of a new instrument. Space
is acquired in the console as described in
Adding an
Instrument to a Console
. Initially, the
instrument is not created. Instead, you are presented
with a list of values from which to select the first
value of the instrument. The list allows you to
select any value on Localhost (see
The Meaning of
Localhost in xmperf)
. If your first action
is to click on the End Selection button in the
selection box, the instrument is not created.
Once
you've selected a value for your instrument the
instrument is created with that value as its first
one. You then see a dialog box that allows you to
select the way you want this value to be plotted. For
details on this, see Changing the
Properties of a Value
rel="pagenum">. When you have set the
options for the first value of the new instrument,
you can select and set the options of additional
values to be added to the instrument. When you're
done, click on the End Selection button in the
selection box.
- Add Remote Instrument
- Every instrument must show values from one single
data-supplier host. If the instrument shows values
from a remote data-supplier host, it's called a
remote instrument. This menu selection allows you to
add a remote instrument.
The first you'll see when
you select Add Remote Instrument is a
selection box with a list of all the currently
available data-supplier hosts. From this list you
pick the one you want by clicking on it and then
clicking on the Done menu item in the menu bar
of the box. This produces a small pulldown menu. If
you click on the Cancel menu item, the box
goes away and no instrument is created. If you click
on the Reselect menu item, the list of
data-supplier hosts is refreshed. If you click on the
Accept Selection menu item, things proceed as
described for Add Local Instrument above, except that
you are presented with a list of values on the
data-supplier host you selected.
Note: With the Performance Toolbox
Local feature of Version 2.2 or later, only the
local host is available for selection.
- Tabulating Window
- Select this menu item to display a tabulating window
for the selected instrument. If a tabulating window
is already displayed when you select this item, that
window is closed. Tabulating windows are
special forms of windows that tabulate the values of
the instrument as data is received and will also
display a line with a weighted average for each
value. Tabulating windows are described in more
detail in Tabulating
Windows .
-
- Copy Instrument
- Causes a new instrument to be added to the console.
The new instrument is an exact copy of the currently
selected instrument and is added as described in
Adding an
Instrument to a Console
.
-
- Delete Instrument
- As a precaution against unintended deletion, a dialog
box pops open when you ask to delete an instrument.
You then have to accept the deletion or cancel it.
-
- Modify Instrument
- This selection causes a cascade menu to appear. An
example is shown in the figure The
xmperf Modify Instrument Menu
. The cascade
menu has ten items, all of which are concerned with
the status and properties (as described in
Instruments
)
of the instrument rather than the properties of
individual values in the instrument. The menu items
are:
- Resynchronize
- Autoscale
- Interval
- History
- Shift
- Space
- Style & Stacking
- Foreground
- Background
- Change Path
All these are described in
The Modify
Instrument Submenu .
- Resize Instrument
- Allows you to resize the selected instrument as
described in Resizing
Instruments in a Console
.
-
- Move Instrument
- Allows you to move the selected instrument as
described in Moving
Instruments in a Console
.
-
- Unselect Instrument
- Deselects the selected instrument and removes the
dashed line around it.
-
- Select Instrument
- Serves as a reminder of how you select instruments.
When you select this item an information window pops
open and gives you a brief description of the
selection principles.
The Modify Instrument Submenu
The xmperf Modify Instrument Menu
This submenu appears when you select the Modify
Instrument menu item from the Edit Console menu. It
contains menu items to modify all of the properties that
apply to an instrument. The items are:
- Resynchronize
- Allows you to ask for the instrument's network
connection to the data-supplier host to be
resynchronized (renegotiated). Make this selection
when you notice that the instrument is no longer
receiving input, which indicates that the remote
supplier host is no longer on the network or that its
xmservd daemon has aborted or was killed. If
you select this menu item and the instrument is still
not receiving input from the data-supplier host, most
likely the remote host is not up. Wait until you can
get a response to a ping, before trying again.
If,
after having resynchronized one instrument, xmperf
estimates the total resynchronizing to take more than
12 seconds, a dialog box pops open. From the window
you can choose to terminate the resynchronizing or
continue it. If you terminate it, none or only some
of the instruments defined for the remote host will
be active. Under normal circumstances, at least one
instrument should be active.
If, during any one resynchronizing operation, the
estimated total elapsed time to complete the
operation increases above 120% of what you previously
approved of, the dialog box appears again showing you
the new estimated time to completion of the
operation.
Note: While this dialog box is
displayed, no other window can be used. You must
click on either Continue Resync or Stop
Resync to remove the dialog box before other
X events are processed.
- Autoscale
- Sometimes an instrument receives data values that are
way above the high range of the instrument. Since
recording type instruments can show no more than 105
percent of the high range (scale), readings above 105
percent are truncated at approximately 105 percent.
To
find the right scale in such situations, use this
menu selection. When you select it, xmperf
scans all values in the instrument to determine if
any one exceeds 105 percent of the high scale. The
scan uses all data values collected in the history of
the instrument. Any value that does exceed 105
percent of the high scale at any point in the
recorded history has its high scale adjusted so that
the highest peak is shown somewhere between the 50%
and the 100% mark in the graph.
If stacking is in effect for the instrument, the
peak is determined as the sum of all values using the
primary style of the graph at any one point in
history.
The changed scales are recorded with the
instrument as if you had made the change manually.
Therefore, when you leave xmperf, you'll be
asked whether you want to save the changes to the
configuration file.
- Interval
- Pops open a dialog box and displays a sliding scale
with the current value of the interval property of
the instrument. The sliding scale adjusts to the
current value so that you can change small values
with a granularity of 0.1 second and larger values
with a granularity of one minute. By using the
slider, you can set the sampling interval in the
range 0.2 second to 30 minutes. To change the
interval between observations, select the slider with
the mouse and move it to the value you want. Then
release the slider and click on the Proceed
button. The xmservd daemon on the remote
Data-Supplier host is sent a change_feeding
message every time you click on Proceed.
Even
though the sampling interval can be requested as any
value in the above range, it may be rounded by the xmservd
daemon on the remote system that supplies the
statistics. For example, if you request a sampling
interval of 0.2 second but the remote host's daemon
is configured to send data no faster than every 500
milliseconds, then the remote host determines the
speed.
When the interval is changed, the instrument is
redrawn with the new properties including a new
pixmap (image) of the instrument if it's a recording
instrument. Note that until a time corresponding to
the size of the history property has elapsed, the
history of the instrument is a mixture of
observations taken with the old interval and the new
one you chose.
If you choose the Save Buffer option from
one of the recording menus, the data saved to the
recording file will have time stamps that assume the
interval has been unchanged (and identical to the
value of the interval property at the time the buffer
is saved). It is suggested that you don't save
buffers of instruments that have had their sampling
interval changed if exact timing of historic events
is important.
- History
- Pops open a dialog box and displays a sliding scale,
with the current value of the history property of the
instrument. The scale ranges from 50 to 5,000
observations. To change the number of observations,
select the slider with the mouse and move it to the
value you want. Then release the slider and click on
the Proceed button.
When the history is
changed, the instrument is redrawn with the new
properties including a new pixmap (image) of the
instrument if it's a recording instrument.
Note: If the history property value is
reduced, any excess data the instrument collects
is discarded; similarly, when the value is
increased more memory is allocated to keep the
extra history as observations are collected.
- Shift
- Pops open a dialog box, and displays a sliding scale
with the current value of the shift property of the
instrument. The scale ranges from one more than the
current value of the space property to 20 pixels. To
change the number of pixels to shift, select the
slider with the mouse and move it to the value you
want. Then release the slider and click on the Proceed
button.
When the shift property is changed, the
instrument is redrawn with the new properties
including a new pixmap (image) of the instrument if
it's a recording instrument. If you want to reduce
the value of this property to a value smaller than
the current value of the space property, you must
first reduce the value of the space property, then
repeat the operation for the shift property.
- Space
- Pops open a dialog box, and displays a sliding scale
with the current value of the space property of the
instrument. The scale ranges from zero to one less
than the current value of the shift property. To
change the number of pixels spacing between bars,
select the slider with the mouse and move it to the
value you want. Then release the slider and click on
the Proceed button.
When the space property
is changed, the instrument is redrawn with the new
properties including a new pixmap (image) of the
instrument if it's a recording instrument. If you
want to increase the value of this property to a
value that is larger than the current shift value,
you must first increase the value of the shift
property to one more than what you want the space
property to be, then repeat the operation for the
space property.
- Style & Stacking
- Causes the dialog box shown in the following figure to pop open.
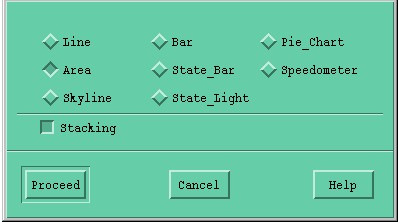
Dialog Box to Change Style and Stacking
- Foreground
- Pops open a dialog box with one button for each of
the colors:
- Black, white, and grey10, grey20, ... grey90.
- The colors defined in the X resource file
with the resources
ValueColor1
through ValueColor24
.
- Any additional colors referenced in the xmperf
configuration file.
Below the color
buttons, eleven buttons show how the current
selection of foreground and background colors
look when each of the eleven tiles is chosen.
The eleven tile buttons are numbered for easy
reference but in the configuration file,
tiles are referred to with symbolic names as
described in Explaining
the xmperf Configuration Files
. The
color box is shown in the following figure.
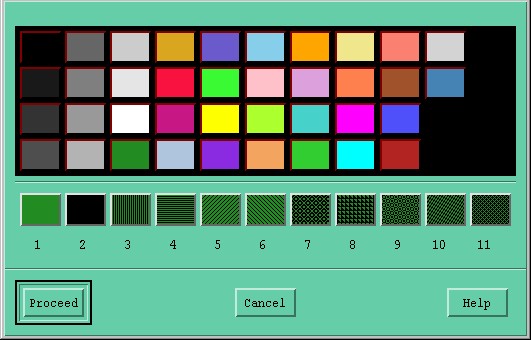
Dialog Box to Change Color in
xmperf
- Background
- Works exactly as foreground color , only it changes
the background color of the instrument.
-
- Change Path
- This menu item gives you the possibility to
"remount" the instrument on a different
host. The name of the menu item means that you
exchange the hosts part of the path names of
all values in the instrument with a new host name.
For example, assume the instrument is monitoring
statistics on host pjank. By selecting a new
host name, such as alvor, you cause the
instrument to be monitoring alvor.
The new
host name is selected from a popup list of host names
containing all the currently available data-supplier
hosts. From this list you pick the one you want by
clicking on it and then clicking on the Done
menu in the menu bar of the box. This produces a
small pulldown menu. If you click on the Cancel
menu item, the box goes away and no new path is
selected. If you click on the Reselect menu
item, the list of data-supplier hosts is refreshed.
If you click on the Accept Selection menu
item, the selected host is chosen as the remote host
for all statistics in the instrument.
Note: With the Performance Toolbox
Local feature, only the local host is available
for selection.
As the instrument is changed to monitor the new
host, it is possible that it references statistics
that are not available on the new host. Such
statistics do not appear in the changed instrument.
Similarly, the instrument may reference statistics
that were not available on the previous host, but
exist on the new host. Such statistics are added to
the instrument.
If recording is active for the instrument at the time you
change one of the following properties of the instrument, the
change has no effect on the recording. The instrument
definition is saved when the recording starts, and subsequent
changes do not affect the recording file. The properties
influenced are:
- History
- Shift
- Space
- Style
- Stacking
- Foreground
- Background
All this means is that the initial properties of the
playback console are as recorded in the recording file. As
described in Playback
Console Windows ,
all the above properties can be
changed before or during playback.
The Edit Value Menu
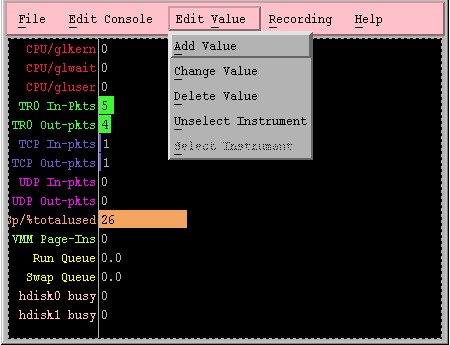
The xmperf Edit Value Menu
The Edit Value pulldown menu has five items as shown in
the preceding figure. The
first four items are active only when an instrument is
selected. The last one is active only when no instrument is
selected. The menu items are:
- Add Value
- This menu item is used to add a value to an
instrument. It is done by selection from a hierarchy
of value selection windows as described in
Value Selection
.
-
- Change Value
- When you make this menu selection, you must tell xmperf
which value you want to change. If the instrument has
more than one value, you'll see a dialog box with a
set of "radio buttons," one for each of the
values currently defined in the instrument. To
continue, click on the value you want to change and
then on Proceed.
Once a value is selected,
or directly if the instrument has only one value, you
are presented with another dialog box from where you
can change any or all of the properties for the
value. This dialog box is described in
Changing the
Properties of a Value
.
- Delete Value
- When you make this menu selection, you must tell the
program which value you want to delete from the
instrument. To allow this, xmperf pops open a
dialog box with a set of "radio buttons,"
one for each of the values currently defined in the
instrument. Click on the value you want to delete and
then on Proceed.
When a value is selected,
you are asked if you really want to delete the value
from the instrument. Click on OK if you do;
otherwise on Cancel.
- Unselect Instrument
- Deselects the selected instrument and removes the
dashed line around it.
-
- Select Instrument
- Serves as a reminder of how you select instruments.
When you select this item an information window pops
open and gives you a brief description of the
selection principles.
The Recording Menu
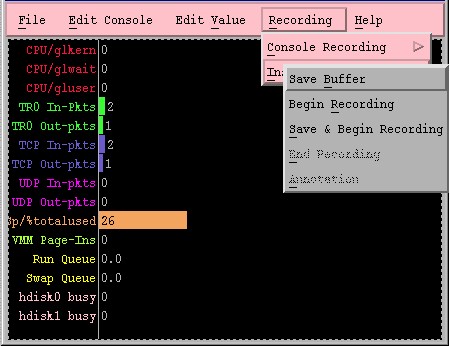
The xmperf Recording Menu
The menu item yields a pulldown menu with two items. Both
items represent cascading submenys, one of which is shown in the
figure above. The first item is
always active; the second one is active only when an instrument
is selected. The menu items are:
- Console Recording
- Pops open the recording submenu that allows you to start
or stop recording from the entire console. For details,
see Recording
Methods .
-
- Instrument Recording
- Pops up the recording submenu that allows you to start or
stop recording from the selected instrument. For details,
see Recording
Methods .
The Help Menu
This item contains two menu lines. The first line provides
help on understanding the intended use of the console. Help
for the console is shown if a simple help file
(see Simple Help File Format
is present and contains a help screen for the console.
The second line is the prescribed On Version that
displays a short message informing you of the version of xmperf.
Console Popup Menus
When xmperf is configured with popup menus, a popup
menu appears whenever you move the mouse pointer into a
console and click the left or middle mouse button. If the
mouse pointer is within the outline of an instrument, that
instrument is selected and the full set of popup menu choices
are active. If the mouse pointer is positioned so it is not
within any instrument, the menu still appears but some of the
menu items that require an instrument to be selected are
inactive or ghosted. You select from the menu by
clicking the right mouse button on the menu item you want.
The menu that pops open contains the items listed below.
Some menu items produce a cascade menu when selected; they
are marked with the word "submenu" in parentheses
and described in separate sections after the direct menu
items:
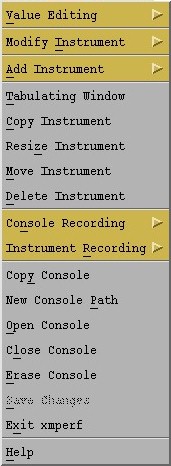
- Value Editing (submenu)
- Modify Instrument (submenu)
- Add Instrument (submenu)
- Tabulating Window
- Copy Instrument
- Resize Instrument
- Move Instrument
- Delete Instrument
- Console Recording (submenu)
- Instrument Recording (submenu)
- Copy Console
- New Console Path
- Open Console
- Close Console
- Erase Console
- Save Changes
- Exit xmperf
- Help
|
|
The xmperf Console Popup
Menu
An example of the xmperf popup menu is shown in the preceding figure. The
menu items that take you directly to a function are the following:
- Tabulating Window
- Select this menu item to display a tabulating window
for the selected instrument. If a tabulating window
is already displayed when you select this item, that
window is closed. Tabulating windows are special
forms of windows that will tabulate the values of the
instrument as data is received and will also
calculate a line with a weighted average for each
value. Tabulating windows are described in more
detail in Tabulating
Windows .
-
- Copy Instrument
- Causes a new instrument to be added to the console.
The new instrument is an exact copy of the currently
selected instrument and is added as described in
Adding an
Instrument to a Console
.
-
- Resize Instrument
- Allows you to resize the selected instrument as
described in Resizing
Instruments in a Console
.
-
- Move Instrument
- Allows you to move the selected instrument as
described in Moving
Instruments in a Console
.
-
- Delete Instrument
- A dialog box pops open when you ask to delete an
instrument. You then accept the deletion or cancel
it. This safeguards you against unintended deletion
of instruments.
-
- Copy Console
- When you select this option, a new console is made as
an exact copy of the selected console. The first
you'll see is a dialog box that prompts you for a
name for the new console. You enter the name of your
choice as described in Choosing
a Name
.
All the rest is done automatically.
-
- New Console Path
- This menu item gives you the possibility to
"remount" all the instruments in the
console on a different host. The name of the menu
item means that you replace the hosts part of
the path names of all values in the console with a
new host name. For example, assume a console has two
instruments, one monitoring statistics on host pjotr
and the other monitoring statistics on host basse.
By selecting a new host name, say mango, you
cause both instruments to be monitoring mango.
The new host name is selected from a popup list of
host names containing all the currently available
data-supplier hosts. From this list you pick the one
you want by clicking on it and then clicking on the Done
menu in the menu bar of the box. This produces a
small pulldown menu. If you click on the Cancel
menu item, the box goes away and no new path is
selected. If you click on the Reselect menu
item, the list of data-supplier hosts is refreshed.
If you click on the Accept Selection menu
item, the selected host is chosen as the remote host
for all statistics in the console. Note that with the
Performance Toolbox Local feature, only the local
host is available for selection.
As the instruments are changed to monitor the new
host, some may reference statistics that are not
available on the new host. Such statistics do not
appear in the changed instrument. Similarly, the
instrument can contain referenced statistics that
were not available on the previous host but exist on
the new host. Such statistics are added to the
instrument.
- Open Console
- This selection produces a popup menu containing all
the consoles defined in the Monitor menu of the main
window and its submenu of skeleton consoles. For
convenience, this selection is placed here to allow
you total control even without having the main window
visible.
-
- Close Console
- When you select this item the current console is
closed and all historic data collected for its
instruments is lost. If recording is active for the
console or any instrument in the console, recording
stops and the recording file is closed. You can get
the same effect by selecting the console from the
Monitor menu of the main window or from the Open
Console menu. Of course, since the console is active,
its name is preceded by an asterisk in the menus, so
selecting it deactivates (or closes) the console. An
alternative way of closing the console is to select
the Close option from the Window Manager menu.
-
- Erase Console
- Selecting this item erases the console definition
from the Monitor menu (and from the configuration
file if and when changes are saved). Before the
console is erased, the actions described for the Close
Console menu item are carried out. To make sure
you don't delete a console accidentally, you are
prompted to verify the selection before it is carried
out.
-
- Save Changes
- When the console has not been modified by you, or
when such modifications have already been saved
previously, this menu selection is inactive: you
can't select it. When you make a change to the
console, this menu selection becomes active.
When
you select this menu item, all changes to the console
(but not to other consoles) are written to the
configuration file. After the changes are saved, the
menu selection is inactivated until new changes are
made to the console.
- Exit xmperf
- This item works exactly like the Exit xmperf
selection of the File menu in the main window. It is
placed here to allow you total control even when the
main window is minimized.
-
- Help
- This item is intended to provide help to understand
the intended use of the console and related other
consoles and tools. Help for the console is shown if
a simple help file
(see Simple Help File
Format)
is present and contains a help
screen for the console.
Value Editing Submenu
The Value Editing submenu has three items:
- Add Value
- A menu item used to add a value to an instrument.
This is done by selection from a hierarchy of value
selection windows as described in
Value Selection
.
-
- Change Value
- When you make this menu selection, you need to
indicate which value you want to change. If the
instrument only has one value, the choice is obvious;
otherwise you'll see a dialog box with a set of radio
buttons, one for each of the values currently defined
in the instrument. To continue, click on the value
you want to change and then on Proceed.
Once
a value is selected, you are presented with another
dialog box from where you can change any or all of
the properties for the value. This dialog box is
described in Changing
the Properties of a Value
.
- Delete Value
- When you make this menu selection, you must indicate
which value you want to delete from the instrument.
To simplify doing this, a dialog box with a set of
"radio buttons," one for each of the values
currently defined in the instrument, pops open. To
continue, click on the value you want to delete and
then on Proceed.
When a value is selected
you are asked if you really want to delete the value
from the instrument. Click on OK if you do;
otherwise on Cancel.
Modify Instrument Submenu
The Modify Instrument submenu is identical whether you
have configured xmperf for pulldown or popup menus. It
is described in The
Modify Instrument Submenu
.
Add Instrument Submenu
The Add Instrument submenu has two items:
- Local Instrument
- Selecting this menu item causes the console to be
prepared for the addition of a new instrument. Space
is acquired in the console as described in
Adding an
Instrument to a Console
. Initially, the
instrument is not created. Instead, you are presented
with a list of values from which to select the first
value of the instrument. The list allows you to
select any value on Localhost
(see The Meaning of
Localhost in xmperf
). If your first action
is to click on the End Selection button in the
selection box, the instrument is not created.
Once
you've selected a value for your instrument, the
instrument is created with that value as its first
one. You will then see a dialog box that allows you
to select the way you want this value to be plotted.
For details of this, see
Changing the
Properties of a Value
. When you have set the
options for the first value of the new instrument,
you can select and set the options of additional
values to be added to the instrument. When you're
done, click on the End Selection button in the
selection box.
- Remote Host Instrument
- Every instrument must show values from either the
host where xmperf is executing or from one
single data-supplier host. If the instrument shows
values from a data-supplier host, it's called a
remote instrument. This menu selection allows you to
add a remote instrument.
A selection box with a
list of all the currently available data-supplier
hosts appears. From this list, pick the one you want
by clicking on it and then clicking on the Done menu
in the box. This produces a small pulldown menu. If
you click on the Cancel menu item, the box goes away
and no instrument is created. If you click on the
Refresh Host List menu item, the list of
data-supplier hosts is refreshed. If you click on the
Accept Selection menu item, things proceed as
described in Local
Instrument ,
except that you are presented
with a list of values on the data-supplier host you
selected.
Note: With the Performance Toolbox
Local feature of Version 2.2 or later, only the
local host is available for selection.
Recording Submenus
The Recording Submenus Console Recording and
Instrument Recording are identical whether you have
configured xmperf for pulldown or popup menus. They
are described in The
Recording Menu .
Playback Console Windows
The Recording and
Playback with xmperf chapter
describes the use of
the playback facility of xmperf. This section
describes how you modify the appearance of a playback
console.
Regardless of whether xmperf is configured for
popup or pulldown menus, the menu you use to change the
appearance of a playback instrument is always a popup menu.
It is activated by placing the mouse pointer within an
instrument and then clicking the left or middle mouse button.
The popup menu you get is a subset of the submenu described
in The Modify
Instrument Submenu
plus some special items. The menu
items are:
- Tabulating Window
- Autoscale
- Maxiscale
- History
- Shift
- Space
- Style and Stacking
- Foreground
- Background
- Change Value
- Delete Value
- Move Instrument
- Resize Instrument
- Erase Instrument
- Annotation Notes
- Write Current View
|
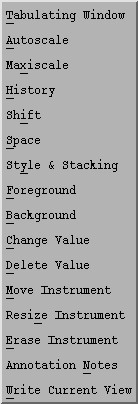 |
The xmperf Playback Popup
Menu
The things you can do are all related to how the recorded
data is presented. You can change any or all of the above
properties of the instrument that was clicked on to bring up
the menu. This can be done before or after you start
playback. All changes, except deletions and the effect of the
selections Autoscale and Maxiscale, can be
changed as many times as you like, allowing you to re-play a
particular recording with many different appearances.
The following is a brief description of how to use the
menu items:
- Tabulating Window
- Select this menu item to display a tabulating window
for the selected instrument. If a tabulating window
is already displayed when you select this item, that
window is closed. Tabulating windows are special
forms of windows that tabulate the values of the
instrument as data is received and also calculate a
line with a weighted average for each value.
Tabulating windows are described in more detail in
Tabulating Window
s
.
-
- Autoscale
- When selected, this menu item causes a scan of all
data values collected in the history of the
instrument. Note that for this scan, only values that
have actually been played back since the last Seek
or Rewind are part of the history. Any value
that does exceed 105 percent of the high scale at any
point in the recorded history has its high scale
adjusted so that the highest peak is shown somewhere
between the 50% and the 100% mark in the graph.
If
stacking is in effect for the instrument, the peak is
determined as the sum of all values using the primary
style of the graph at any one point in history.
- Maxiscale
- When selected, this menu item causes a scan of all
data values collected in the history of the
instrument. Note that for this scan, only values that
have actually been played back since the last Seek
or Rewind are part of the history. All values
are adjusted so that the highest peak at any point in
the recorded history is shown somewhere between the
50% and the 100% mark in the graph.
If stacking is
in effect for the instrument, the peak is determined
as the sum of all values using the primary style of
the graph at any one point in history.
- History
- When the history property is changed for a recording
instrument, the instrument is redrawn with the new
properties including a new pixmap (image) of the
instrument. Note that for playback, the purpose of
the history property is to define the size of the
pixmap (image) kept in memory. This is only useful
for recording type instruments and in playback is
only used to determine whether you can scroll the
displayed graph and by how much.
-
- Shift
- When the shift property is changed for a recording
instrument, the instrument is redrawn with the new
properties including a new pixmap (image) of the
instrument. If you want to reduce the value of this
property to a value smaller than the current value of
the space property, you must first reduce the value
of the space property, then repeat the operation for
the shift property.
-
- Space
- When the space property is changed, the instrument is
redrawn with the new properties including a new
pixmap (image) of the instrument if it's a recording
instrument. If you want to increase the value of this
property to a value that is larger than the current
shift value, you first increase the value of the
shift property to one more than what you want the
space property to be, then repeat the operation for
the space property.
-
- Style & Stacking
- This selection causes a dialog box to pop open. The
window has a set of "radio buttons," one
for each possible instrument type, and a single
button that allows you to activate or deactivate the
stacking facility.
You change the primary style of
the instrument by clicking on the instrument type you
want it to be. You select or deselect stacking by
clicking on the stacking button. When you've made
your selections, click on the Proceed button
to implement the changes. After the changes are
applied to the instrument, it is redrawn from the
beginning.
- Foreground
- Allows you to change the foreground color and tile of
the instrument.
-
- Background
- Allows you to change the background color and tile of
the instrument.
-
- Change Value
- When you make this menu selection, you must tell xmperf
which value you want to change. If the instrument has
more than one value, you will see a dialog box with a
set of "radio buttons," one for each of the
values currently defined in the instrument. To
continue, click on the value you want to change and
then on Proceed.
Once a value is selected,
or directly if the instrument has only one value, you
are presented with another dialog box from where you
can change any or all of the properties for the
value. This dialog box is described in
Changing the
Properties of a Value
. Because no new data
values can be added to a recording, the data path can
not be changed from the dialog box.
- Delete Value
- When you make this menu selection, you must tell the
program which value you want to delete from the
instrument. To allow this, xmperf pops open a
dialog box with a set of "radio buttons,"
one for each of the values currently defined in the
instrument. Click on the value you want to delete and
then on Proceed.
When a value is selected,
you are asked if you really want to delete the value
from the instrument. Click on OK if you do;
otherwise Cancel.
- Move Instrument
- Allows you to move the selected instrument as
described in Moving
Instruments in a Console
.
-
- Resize Instrument
- Allows you to resize the selected instrument as
described in Resizing
Instruments in a Console
.
-
- Erase Instrument
- As a precaution against unintended deletion, a dialog
box pops open when you ask to delete an instrument.
You then have to accept the deletion or cancel it.
-
- Annotation Notes
- Opens the annotation list window in which any
existing annotations are listed and from where new
annotations can be added and existing ones modified
or deleted. An example of the annotation list window
is shown in the Annotation
List Window figure
.
-
- Write Current View
- Modifies the control information in the recording
file to reflect the current layout and contents of
the instrument. The original control information is
not saved. If annotations exist in the recording
file, they are reorganized to remove any annotations
marked for deletion and inserting the remaining ones
in an optimal place in the file.
Important xmperf Dialogs
This section covers some of the important dialog boxes, or
value selection windows, you use to customize xmperf.
Value Selection
Value selection can be invoked from the Add Value menu,
implicitly from one of the Add Instrument menus, or from the
dialog box used to change the properties of a value as
described in Changing
the Properties of a Value
. Value selection is done
from cascading lists that work as follows:
A dialog box (which we call the value selection window)
listing the top layer of values you can select from appears.
In this list, lines ending in a slash and three dots signify
that the line itself represents a list at the next
hierarchical level. These lines are context lines. The
remaining lines in the list are called statistics lines,
each of which represents a value.
An example of a value selection window is shown in the following
figure. It shows four statistic lines and six
context lines.
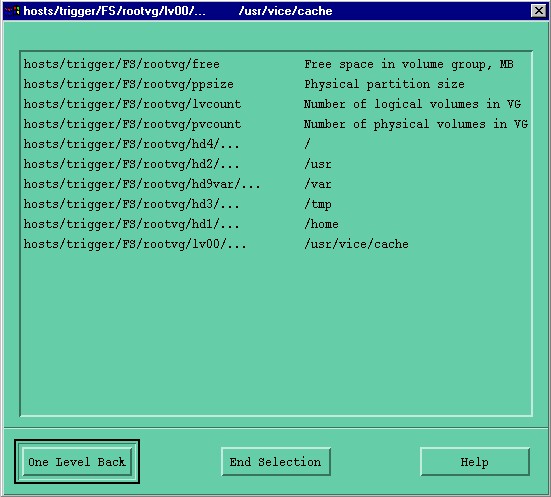
Value Selection Dialog Box for xmperf
If you click on a context line, you're shown the next
level of statistics in another dialog box that's placed just
below the top frame of the first dialog box. This new box
contains a list that can include context lines as well as
statistics lines. You can repeat the process until the last
list you get contains only statistics lines. Note that as you
move through the hierarchy, the names displayed in the list
become longer as the preceding hierarchical levels are
prefixed to the names, separated by slashes.
The title bar of each dialog box shows the context path
for the lines in that dialog box. This is another way of
showing the hierarchical levels of the values. The title bar
of the window shown in the "Value Selection Dialog Box,
xmperf" shows that this value selection window is at the
third hierarchical level because the title bar shows two
context levels after the host name.
If you click on a statistics line, the result depends on
how you invoked this function:
- If you invoked the function from the Add Value menu
or one of the Add Instrument menus, the line you
selected immediately is added to the instrument. The
value is added at the first empty value slot in the
instrument and inherits the color of that slot,
whatever that color is. All other properties are
initially set to their default values as described in
the data structures behind the list you chose from.
Then
you see another dialog box (described in
Changing the
Properties of a Value
) that allows you to
modify the new value's properties. If you want to add
the selected value to the instrument, regardless of
whether you changed any of its properties, you need
to click on the Apply button in the dialog
box. If you click on Cancel, all the changes
you made are discarded and the value is removed from
the instrument.
When the property change window disappears, you
return to the Value Selection window. You can then
select another value to be added to the instrument.
This can be repeated until the maximum number of
values allowed in an instrument is reached. When you
have finished adding values, you close the value
selection windows by clicking End Selection.
- If you invoked the function from the dialog box used
to change the properties of a value
(see Changing the
Properties of a Value
) then the value you
selected replaces the value you are modifying. You
can repeat the operation (selecting another value),
and each time the selected value replaces the
instrument value. When you are sure you have the
value you want, click on End Selection in the
selection dialog box to return to the property change
Window. Now click on Apply for the change to
remain in effect. Select Cancel if you want to
return to the original instrument definition.
When
you have more than one value selection window
displayed you can jump backwards in the stack
of windows. There are two ways:
- One Level Back
- This is one of the buttons in the value
selection windows. When you click it, the
window disappears and the immediately lower
window becomes active. This way, you can go
one level back before selecting another
value.
-
- Closing the Window
- Each Value Selection window has window
manager decorations, including the window
menu that allows you to close the window. If
you close a window this way, you also close
all windows on top of that window. If the
window you closed is not the lowest window,
one or more Value Selection windows remains
displayed. This gives you a way of skipping
more than one level back before selecting
another value. The context path displayed in
the window frame helps you determine which
window to close.
Creating a Console
Creating a new console requires two steps:
- Select a name for the new console and create an empty
console.
- Once an empty console is created, add the instruments
you want in the new console.
Choosing a Name
When you select Add New Console from the Monitor
menu of the main window, a small dialog box appears. The box
has an input field where you can type the name you want the
new console to have. Initially, the input field has a name
constructed from the date and time. You can change the name
to anything, as long as you don't use names of existing
consoles.
If the name you enter contains periods (full stops),
slashes, or colons, xmperf converts these characters
to commas, underscores, and semicolons, respectively. This is
done to prevent characters in a console name from clashing
with the characters used for delimiters in the configuration
file or with file names of recording files.
After you have entered the name you want, press the Enter
key or click on Proceed to create the empty new
console. The creation of the console causes it to be added to
the Monitor menu (with its name preceded by an asterisk
because it is active). As long as the console is empty (has
no instruments), it won't be saved to the configuration file,
even if you ask to save all changes. However, once the new
console contains an instrument it's added to the
configuration file when you ask to save it or to save all
changes.
Adding Instruments to the Console
When initially created, the new console is empty. You'll
need to add at least one instrument to the console before you
can use it for anything. If xmperf is configured with
pulldown menus, use the Edit Console pulldown menu and select
one of the "add instrument" menu items. If you use
popup menus, click on the empty console and select Add
Instrument from the menu.
Changing the Properties of a Value
The dialog box used to change the properties of a value
appears when:
- You select the Change Value menu item.
- You select the Add Value menu item.
- You add a new instrument.
The window is a true dialog box in the sense that whatever
you change from the window has an immediate effect on the
instrument and value with which you are working. If the
instrument is large or complicated or if your host is heavily
loaded, "immediate" may mean within a few seconds.
The dialog box is shown in the following figure.
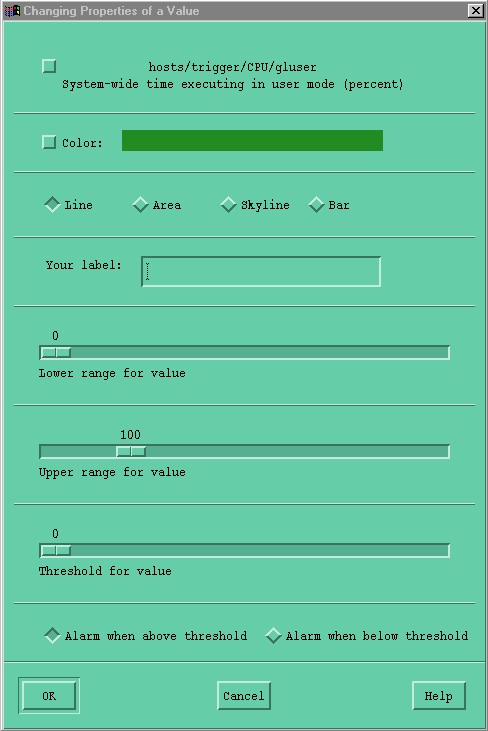
Change Value Dialog Box
Because the effect of your changes are seen as you make
them, be sure to start by moving the dialog box so that it
doesn't obscure the instrument you work with. Once you've
made all the changes click on Apply to make the dialog
box go away and the changes made permanent. Click on Cancel
to restore the original instrument properties.
Three of the properties are represented in the dialog box
by a sliding scale. Scales enable you to change a numerical
value by using the mouse instead of the keyboard. However, it
can sometimes be difficult to hit exactly the value you want.
To cope with this problem, the sliders in the dialog box
adjust to the value they are displaying. This is done by
rounding by 10, 100, 1,000, 10,000, or 100,000. When rounding
is done, a multiplication factor is displayed as part of the
slider text. One other way we cope with the precision is by
limiting the high value to five times the current value. This
means that if the current value is 100 and you want to
increase it to 100,000, then you must do it in steps. For
example:
- With current value = 100, change to 500.
- With current value = 500, change to 2,500.
- With current value = 2,500, change to 10,000.
- With current value = 10,000, change to 50,000.
- With current value = 50,000, change to 100,000.
The major advantage is that of not having to accept values
such as 99,973 or 100,744 when you want 100,000.
The actual changing of values is done by moving the mouse
pointer to the slider and then pressing the left mouse
button; while holding the button down, move the mouse pointer
left or right to decrease or increase the value. As you move
the pointer, the value corresponding to the slider position
is displayed. When you have reached the desired value,
release the mouse button.
The dialog box always looks the same and contains the
following sections:
- Value path and description
- Initially, holds the path name and description of the
value you are changing. If you click on the button
you are presented with the first of a series of value
selection windows as described in
Value Selection
.
As you pick another value for the instrument by
selecting from the lists of values, the text
displayed here changes to the path name and the
description of the new value.
As you change the value, the property values for
ranges and threshold also change because the default
values corresponding to the new value are taken.
Therefore, before changing any other properties, make
sure you are working with the value you want.
- Color
- The name of the current color for drawing the value
is displayed in a label field next to a button. The
label field is painted in the current color and tile
of the value.
To change the color and the tile of
the value, click on the button. This causes the color
selection dialog box to appear. You select a new
color or tile from the dialog box by clicking on one
of the color selection or tile buttons. Try however
many color and tile combinations you want and click
on Proceed in the color selection window when
you find what suits you.
- Secondary style
- If the primary style of the instrument you are
working with is one of the state graphs, only one
radio button is displayed for secondary style. That's
because you can not have a secondary style different
from the primary style with state graphs. The single
radio button and its text are merely for your
information and no action is taken if you click on
it.
For recording style graphs, however, you
always are presented with a radio button for each of
the recording graph styles. The one that's used as
secondary style for the value you are changing
appears to be pressed in (selected). You can change
the secondary style to any of the styles shown by
clicking on the radio button of your choice.
- Your label for the value
- Allows you to specify your own label to be displayed
in the instrument for this value. By default, this
field is empty, and the path name of the statistic is
used in the instrument. By entering a text string of
up to 32 characters, you can override the default.
In
case of values for processes, you can use two
keywords to specify which part of the constructed
value name you want displayed as the value name.
Processes are identified by a name constructed by
concatenating the process ID (PID) with the name of
the executing command, separated by a ~(tilde). If
you do not enter your own label, this constructed
name is used to identify process values. By entering
the keyword cmd, you can change this to be
only the name of the executing command; by entering
the keyword pid, you change it to be only the
PID of the process. The distributed configuration
file has an example of the use of the two keywords in
the skeleton console named "Local
Processes."
- Lower range
- The sliding scale (slider) can move from value zero
to one less than the current upper range property
value. If you want a non-zero lower scale make sure
you have the upper scale set correctly first.
-
- Upper range
- The sliding scale (slider) can move from 1 to
1,000,000,000; but, as described earlier, you may
have to do this in steps.
-
- Threshold
- The sliding scale (slider) can move from value 0 to
1,000,000,000; but, as described earlier, you may
have to do this in steps. The threshold value only
has a meaning for state light type instruments. The
threshold type (described below) determines how to
interpret the threshold value.
-
- Threshold type
- This section has two radio buttons. One, and only
one, must be active. The section describes the
threshold type used for state light type instruments
as either ascending or descending.
Tabulating Windows
Whenever an instrument is active, it updates a graphical
display of the values it contains. Each time a new set of
values is received, the graphical window is updated. In
addition to the graphical display, an instrument can
simultaneously tabulate the data values as they are received.
This is done by opening a tabulating window.
A tabulating window is opened for an instrument when you
select the menu item Tabulating Window. If you do it
one more time, the tabulating window is closed. You can also
close a tabulating window from its window manager menu.
A tabulating window is shown in the figure below.
It has three components:
- Header lines
- Weighted average line
- Detail lines
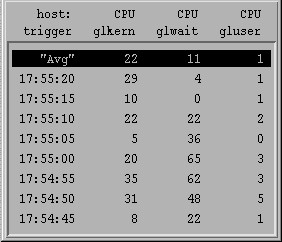
Example of a Tabulating Window
Tabulating Window Header Lines
The header lines are constructed using either
user-supplied labels for the values (if available) or path
names. The path name with most levels determines the number
of header lines. The first value in the Example
of a Tabulating Window
figure, has a path name of:
hosts/nchris/CPU/cpu0/kern
That gives five levels but in order to keep the number of
header lines down, all tabulating windows show the host name
in the upper left corner of the window. Since all values of
any instrument have the first two levels of the path name in
common, they are not shown for each value.
Tabulating Window Weighted Average
Line
The first data line is the "weighted average
line" showing an approximation to an average for each
value. The formula used to calculate the average is:
new_avg = observation x weight + old_avg (1 - weight)
The weight in the formula is specified by the command line
argument -p or the X resource Averaging. The
default weight is 50%, which is used in the formula above as
the value .5.
To make the weighted average line stand out from detail
lines, it is shown in reverse video.
Tabulating Window Detail Lines
The detail lines show actual data values as they are
received. At the far left of each line is a time stamp
showing the time at which the data values were captured,
using the time of day of the host that generated the data
values. As new observations are received, previous data lines
move down and, eventually, disappear off the bottom of the
list of detail lines.
The default number of detail lines sent to a tabulating
window is 20. However, when the window initially appears, it
typically shows only the top four detail lines including the
weighted average line. Use the window manager to resize the
window if you want to see more detail lines.
The number of detail lines in tabulating windows can be
changed with the X resource TabWindowLines. You can
specify from 2 to 100 lines. The number of lines you specify
should include the weighted average line. If you specify more
than 25 lines, the tabulating window provides a vertical
scroll bar that allows you to scroll down to see the last of
the detail lines.
Column Width in Tabulating
Windows
The width of each column in tabulating windows defaults to
9 characters. Data values are always cut to fit the active
column width. If this would cause digits to be removed from
the value, it is divided by either 1,000 or 1,000,000 as
required and suffixed with a K or M,
respectively. Where applicable, column headings are truncated
so that at least one space separates two headings.
The default column width can be changed through the X
resource TabColumnWidth
.
A value from 5 through 15 can be specified.
Decimal Places in Tabulating
Windows
Some values may be tabulated with one decimal place. This
is done if the value's High Scale property is less than or
equal to a global threshold that defaults to 10. This is done
to allow extra granularity for values that never have very
high readings.
The global threshold can be changed with the X resource DecimalPlaceLimit
.
Tabulating Window Title Bar
The title bar of tabulating windows shows the name of the
host where xmperf is executing followed by (TAB):
and the identification of the instrument. The instrument is
identified by the console name and the sequence number of the
instrument within the console.
[ Previous |
Next |
Contents |
Glossary |
Search ]