This task shows you how to create a Line Force Density applied to a surface geometry.
Line Force Densities are intensive loads representing line
traction fields of uniform magnitude applied to curve geometries.
Line Force Density objects belong to Loads objects sets.
The user specifies three components for the direction of the field, along with a magnitude information. Upon modification of any of these four values, the line traction vector components and magnitude are updated based on the last data entry. The line traction vector remains constant independently of the geometry selection.
Units are line traction units (typically N/m in SI).
Line Force Density can be applied to the following types of supports:
|
Geometrical Feature |
Mechanical Feature |
Analysis Feature |
||||
|
Spatial Groups |
Geometrical Groups |
Groups by Neighborhood |
Groups by Boundary |
Others |
||
|
Edge |
|
|
|
|
|
|
To know more, refer to Authorized Supports.
Open the sample00.CATAnalysis document from the samples directory.
-
Go to View > Render Style > Customize View and make sure the Shading, Outlines and Materials options are active in the Custom View Modes dialog box.
-
Click Line Force Density
 in the Loads toolbar.
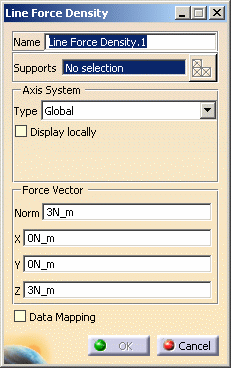
The Line Force Density dialog box appears.

-
You can change the identifier of the Line Force Density by editing the Name field.
-
Set the Axis System.
The Axis System Type combo box allows you to choose between Global, Implicit and User Axis systems for entering components of the line traction field vector:
- Global: if you select the Global Axis system, the components of the surface traction field will be interpreted as relative to the fixed global coordinate system.
- Implicit: if you select the Implicit Axis system, the components of the line traction field will be interpreted as relative to a local variable coordinate system whose type depends on the support geometry.
- User: if you select a User Axis
system, the components of the line traction field will be relative
to the specified Axis system. Their interpretation will further
depend on your Axis Type choice.
To select a User Axis system, you must activate an existing Axis by clicking it in the specification tree. Its name will then be automatically displayed in the Current Axis field.
If you choose the User axis system, the Local orientation combo box further allows you to choose between Cartesian, Cylindrical and Spherical local axis orientations.
- Cartesian: the components of the surface traction field are interpreted as relative to a fixed rectangular coordinate system aligned with the cartesian coordinate directions of the User-defined Axis.
- Cylindrical: the components of the surface traction field are interpreted as relative to a local variable rectangular coordinate system aligned with the cylindrical coordinate directions of each point relative to the User-defined Axis.
- Spherical: the components of the surface traction field are interpreted as relative to a a local variable rectangular coordinate system aligned with the spherical coordinate directions of each point relative to the User-defined Axis.

- You can define the line traction field direction by using the compass.
- You can modify the compass orientation either with the mouse or by editing the compass.
- By applying the compass to any part geometry, you can align the compass directions with the implicit axis directions of that geometry: drag the compass by handling the red square and drop it on the appropriate surface. The normal direction to this surface defines the new direction. Then, click on the Compass Direction button to take this new direction into account. You can now invert the direction if desired, editing the values of the three components.
- Even if a User axis system has been referenced, the
coordinates of the data mapping stay in the Global axis
system.
Only the User axis system directions are taken into account with data mapping.
-
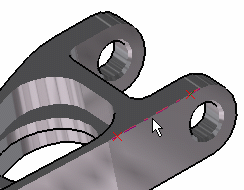
Select the geometry support (an edge) on which the line traction is to be applied.
Any selectable geometry is highlighted when you pass the cursor over it.

You can select several supports in sequence, to apply the Line Force Density to all supports simultaneously.
Symbols representing the Line Force Density are displayed on the support geometry to visualize the traction field.As soon as the support is selected, the Select Mesh Part button is available.
To know more about the Select Mesh Part button, refer to Selecting Mesh Parts. -
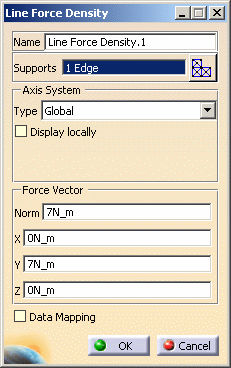
If needed, enter a new value for any one of the four fields: Norm, X, Y and Z in the Line Force Density dialog box.
For example, enter below values for the X, Y, Z components of the line traction field.
The corresponding Norm value is automatically computed and displayed.
- The remaining three fields are automatically computed and displayed.
- The visualized symbols orientation is also updated to reflect the modification.

You can re-use data (Data Mapping) that are external from this version (experimental data or data coming from in-house codes or procedures). For more details, refer to Data Mapping (only available if you installed the ELFINI Structural Analysis product).
-
Click OK.
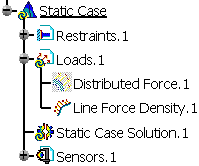
A Line Force Density object appears in the features tree under the active Loads objects set.

- You can either select the edge and then set the Line Force Density specifications, or set the Line Force Density specifications and then select the edge.
- If you select other surfaces, you can create as many Line Force Density loads as desired with the same dialog box. A series of Line Force Densities can therefore be created quickly.
- Loads are required for Stress Analysis computations.
- If several Analysis Cases have been defined in the Finite Element Model, you must activate a Loads objects set in the specification tree before creating s Line Force Density object (only available if you installed the ELFINI Structural Analysis product).
- Line Force Density objects can be edited by a double click on the corresponding object or icon in the specification tree.
The ELFINI Structural Analysis product offers the following additional functionalities:
-
Contextual menu on the load object:
- Line Load Visualization on Mesh: the translation
of your Distributed Force object specifications into solver
specifications can be visualized symbolically at the impacted mesh
nodes, provided the mesh has been previously generated using a mesh
only computation.
To know more, refer to Visualizing Loads on Mesh.
- Line Load Visualization on Mesh: the translation
of your Distributed Force object specifications into solver
specifications can be visualized symbolically at the impacted mesh
nodes, provided the mesh has been previously generated using a mesh
only computation.
-
Contextual menus on the loads set:
- Generate Image: generates an image of the computed load
objects (along with translating all user-defined Loads specs into
explicit solver commands on mesh entities), by generating symbols for
the elementary loads imposed by the Loads objects set. The image can be
edited to include part or all of the options available.
To know more, refer to Generating Images. - Report: the partial status and results of intermediate
pre-processor computations are reported in HTML format. It represents a
subset of the global report capability and generates a partial report
of the loads objects set Computation.
To know more, refer to Generating Reports.
- Generate Image: generates an image of the computed load
objects (along with translating all user-defined Loads specs into
explicit solver commands on mesh entities), by generating symbols for
the elementary loads imposed by the Loads objects set. The image can be
edited to include part or all of the options available.
- Self-balancing: refer to Creating Pressures.
![]()