 |
This task explains how to concatenate a 3D
multi-cell mono-domain FreeStyle curve or separate contiguous curves into a
mono-cell curve.
The resulting curve is a curvature continuous curve (C2). |
 |
Open the
FreeStyle_Part_22.CATPart document.
This document contains two join-type elements, and a set of connex
curves, each identified by different colors. |
 |
-
Click the Concatenate icon
 . .
The Concatenate dialog box is displayed.
-
Set the tolerance value.
|
| |

|
|
This value defines the maximum parametric
deviation allowed between the selected elements and the resulting curve
when concatenating.
The Maximum deviation value displayed in the dialog box (see step 4)
is computed as the standard distance analysis and therefore is not
necessarily the minimum tolerance value to be set in order to concatenate
the curves.
|
|
If the tolerance value you entered is not adequate, a message is
issued prompting you to increase it. However, to help you, the minimum
tolerance value necessary to obtain a
result is then automatically displayed.
If you are using the Auto Update Tolerance mode,
the minimum tolerance value is automatically modified; therefore no
message is issued.
|
|
-
Select the curves you wish to concatenate and click
Apply.
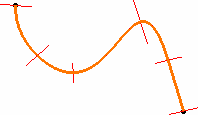
Here we selected Join.2 from the specification tree, and
set the tolerance value to 1.6.
|
| |
|
|
A single curve is previewed, with its segment limits, provided the
tolerance is compatible. If not, no concatenated curve is previewed, and
the OK button is grayed.
|
|
-
Click More>> in the dialog box.
|
| |

|
|
-
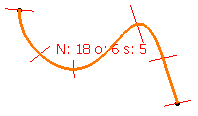
Check the Information option.
The corresponding information is displayed on the resulting curve, that
is:
|
 |
In case you did not check the Information button, the
maximum deviation is also indicated in the dialog box. |
| |
|
| |
-
Check the Auto Update
Tolerance option to automatically update the tolerance value in
case the value you set is too low.
The minimum value to enable the concatenation is displayed and the
concatenation is performed.
|
|
-
Click OK in the Concatenate dialog box.
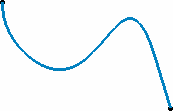
A curve is created, the result of the concatenation of the elements
making up the initial Join.
|
| |
|
 |
- Once you have clicked Apply,
if no resulting curve is displayed, increase the tolerance value.
|
|
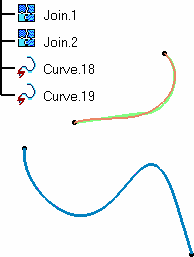
- Multi-selection is available using the Control key. This
means you can select several Join elements for example, and each one will
generate a concatenated curve.
(Join.1 in green is still visible behind Curve.19, but you can notice the
deviation due to the discontinuity of the initial element.)
|
| |
|
|
- Similarly, you can select several contiguous curves using the Control
key, or a trap, to generate a single curve.
If the selected curves are not connex (if there is a gap between two
curves), the Apply button is grayed, and you cannot create the
concatenated curve.
|
|

|

|
|
Set of independent connex curves
|
Resulting concatenated curve
|
|
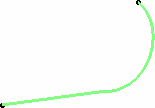
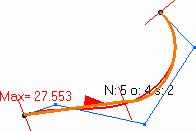
- If the selected elements present a curvature discontinuity (as
illustrated below), you will need to increase the tolerance value
accordingly.
In this case too, the maximum deviation will increase considerably.
|
|
|
|
|
Initial element presenting a discontinuity
|
Deviation onto a discontinuous element
|
|
- Use the Converter Wizard prior to selecting non 3D NUPBS multi-cells
curves for concatenation.
|
 |
Available capabilities from the Dashboard are:
keep original and
furtive display. |
![]()
![]()