This task shows you how to visualize the extrema on an image.
The Von Mises Stress image must be activated, as seen in the previous task Generate an image.
-
Click Image Extrema
 .
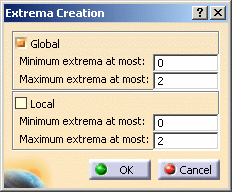
. The Extrema Creation dialog box appears.

To know more about global and local extrema, refer to Creating Extrema.
-
Select the Global option check box.
-
Enter 2 as Maximum extrema at most value.
-
Click OK.
Extrema are indicated on the image as shown below:

The next task shows you how to Generate a Basic Analysis Report.
![]()