The trace facility is more flexible than traditional system-monitor services that access and present statistics maintained by the system. It does not presuppose what statistics will be needed, instead, trace supplies a stream of events and allows the user to decide what information to extract. With traditional monitor services, data reduction (conversion of system events to statistics) is largely coupled to the system instrumentation. For example, many systems maintain the minimum, maximum, and average elapsed time observed for executions of task A and permit this information to be extracted.
The trace facility does not strongly couple data reduction to instrumentation, but provides a stream of trace event records (usually abbreviated to events). It is not necessary to decide in advance what statistics will be needed; data reduction is to a large degree separated from the instrumentation. The user may choose to determine the minimum, maximum, and average time for task A from the flow of events. But it is also possible to:
This flexibility is invaluable for diagnosing performance or functional problems.
In addition to providing detailed information about system activity, the trace facility allows application programs to be instrumented and their trace events collected in addition to system events. The trace file then contains a complete record of the application and system activity, in the correct sequence and with precise time stamps.
A trace hook is a specific event that is to be monitored. A unique number is assigned to that event called a hook ID. The trace command monitors these hooks.
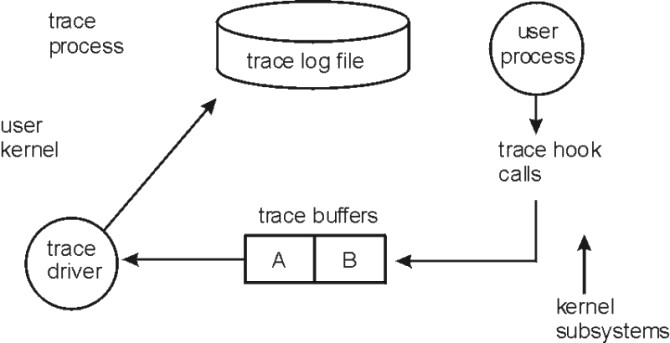
The trace command generates statistics on user processes and kernel subsystems. The binary information is written to two alternate buffers in memory. The trace process then transfers the information to the trace log file on disk. This file grows very rapidly. The trace program runs as a process which may be monitored by the ps command. The trace command acts as a daemon, similar to accounting.
The following figure illustrates the implementation of the trace facility.

Monitoring facilities use system resources. Ideally, the overhead should be low enough as to not significantly affect system execution. When the trace program is active, the CPU overhead is less than 2 percent. When the trace data fills the buffers and must be written to the log, additional CPU is required for file I/O. Usually this is less than 5 percent. Because the trace program claims and pins buffer space, if the environment is memory-constrained, this might be significant. Be aware that the trace log and report files can become very large.
The trace facility generates large volumes of data. This data cannot be captured for extended periods of time without overflowing the storage device. There are two ways to use the trace facility efficiently:
The trace facility provides three distinct modes of use:
A general-purpose trace-report facility is provided by the trcrpt command. The report facility provides little data reduction, but converts the raw binary event stream to a readable ASCII listing. Data can be visually extracted by a reader, or tools can be developed to further reduce the data.
The report facility displays text and data for each event according to rules provided in the trace format file. The default trace format file is /etc/trcfmt, which contains a stanza for each event ID. The stanza for the event provides the report facility with formatting rules for that event. This technique allows users to add their own events to programs and insert corresponding event stanzas in the format file to specify how the new events should be formatted.
When trace data is formatted, all data for a given event is usually placed on a single line. Additional lines may contain explanatory information. Depending on the fields included, the formatted lines can easily exceed 80 characters. It is best to view the reports on an output device that supports 132 columns.