[ Bottom of Page | Previous Page | Next Page | Contents | Index | Library Home |
Legal |
Search ]
Performance Management Guide
Using the Performance Toolbox
The Performance Toolbox (PTX) is a licensed product that allows graphical
display of a variety of performance-related metrics. Among the advantages
of PTX over ASCII reporting programs is that it is much easier to check current
performance with a glance at the graphics monitor than by looking at a screen
full of numbers. PTX also facilitates the combination of information from
multiple performance-related commands and allows recording and playback.
PTX contains tools for local and remote system-activity monitoring and
tuning. The product consists of two main components: the PTX Manager and the
PTX Agent. The PTX Agent is available as a separate licensed product called
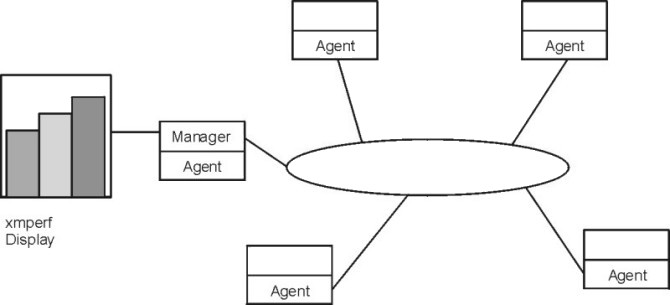
the Performance Aide for AIX. The following figure shows a simplified LAN
configuration in which the PTX Manager is monitoring the activity of several
systems.
Figure 16. LAN Configuration Using Performance Toolbox. This illustration
shows five nodes of a local area network that are connected using the star
topology. Each node on the network has the performance toolbox (PTX) agent
running on it. One of the nodes is the PTX Manager and can monitor the other
nodes via the resident agent.

The main purpose of the PTX Manager is to collect and display data from
the various systems in the configuration. The primary program for this purpose
is xmperf. The primary program used by the Agent
to collect and transmit data to the Manager is xmservd.
PTX is described in detail in the Performance Toolbox Version 2 and 3 for AIX: Guide and Reference and Customizing Performance Toolbox and Performance Toolbox Extensions for AIX.
Recording with the Performance Agent
If you need to record information or a playback facility, several tools
are included with the manager code (xmperf, 3dmon, azizo, ptxrlog). Other
tools (xmservd, ptxtab, ptxsplit) are packaged with the agent code.
Best suited for continuous monitoring are the following tools:
- The ptxrlog command can produce recordings in ASCII
format, which allows you to print the output or post-process it, or it can
produce a recording file in binary to be viewed with the azizo or xmperf commands.
- The xmservd daemon can act as a recording facility
and is controlled through the xmservd.cf configuration file. This daemon can
simultaneously provide near real-time network-based data monitoring and local
recording on a given node.
- The xmtrend daemon, much like xmservd, acts as a recording facility. The main difference is in the
storage requirements for each daemon. Typical xmservd
recordings can consume several megabytes of disk storage every hour. The xmtrend agent was created to focus on providing manageable
24 x 7 long-term recordings of large metric sets.
- The jazizo tool is a Java version that replaces azizo. Jazizo is a tool for analyzing
the long-term performance characteristics of a system. It analyzes recordings
created by the xmtrend daemon, and provides displays
of the recorded data that can be customized.
- The wlmperf tools provide graphical views of Workload
Manager (WLM) resource activities by class. This tool can generate reports
from trend recordings made by the PTX daemons covering
minutes, hours, days, weeks, or monthly periods.
[ Top of Page | Previous Page | Next Page | Contents | Index | Library Home |
Legal |
Search ]

