PDT assesses the current state of a system and tracks changes in workload and performance. It attempts to identify incipient problems and suggest solutions before the problems become critical. PDT became available at AIX Version 4.
For the most part, PDT functions with no required user input. PDT data collection and reporting are easily enabled, and then no further administrator activity is required. Periodically, data is collected and recorded for historical analysis, and a report is produced and mailed to the adm userid. Normally, only the most significant apparent problems are recorded on the report. If there are no significant problems, that fact is reported. PDT can be customized to direct its report to a different user or to report apparent problems of a lower severity level.
The main sections in this topic are:
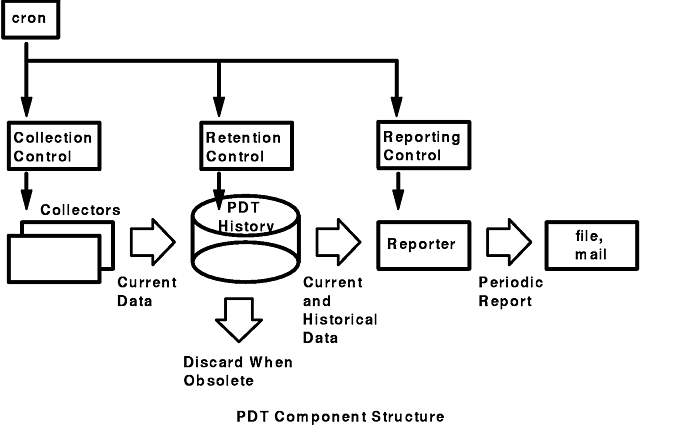
As shown in the figure "PDT Component Structure," the PDT application consists of three components:
PDT considers various aspects of a system's configuration, availability, and delivered performance in making its assessment. In particular, areas of configuration imbalance are sought out (such as I/O-configuration balance, paging-configuration balance) as well as other configuration problems (for example, disks not allocated to volume groups). A wide variety of trending assessments is made, including file sizes, file-system sizes, paging-area usage, network delays and workload-related delays.
PDT collects configuration, availability, workload, and performance data on a daily basis. This data is maintained in a historical record. Approximately a month's worth of data is kept in this way. Also on a daily basis, PDT generates a diagnostic report. The report is mailed to user adm .
In addition to mailing the report, PDT stores a copy in /var/perf/tmp/PDT_REPORT. Before the new report is written, the previous report is renamed /var/perf/tmp/PDT_REPORT.last.
While many common system performance problems are of a specific nature--a system may have too little memory--PDT also attempts to apply some general concepts of well-performing systems to its search for problems. Some of these concepts, together with examples of their application to AIX, are:
In general, if there are several resources of the same type, then a balanced use of those resources produces better performance.
Resources have limits to their use. Trends that would attempt to exceed those limits should be detected and reported.
Trends can indicate a change in the nature of the workload as well as increases in the amount of resource used:
Hardware or software errors often produce performance problems.
Changes Should be Investigated
New workloads or processes that start to consume resources may be the first sign of a problem.
Appropriate Setting of System Parameters
There are many parameters in a system. Are all of them set appropriately?
The PDT report consists of several sections (see the example, below). After the header information, the Alerts section contains identified violations of the concepts noted above. If no alerts are found, the section is not present in the report. The next two sections are for upward trends and downward trends. These two sections focus on problem anticipation, rather than on the identification of existing problems. In general, the same concepts are applied--but with a view toward projecting when violations will occur. If no upward or downward trends are detected, these sections are not present in the report.
______________________________________________________________________________
 Performance Diagnostic Facility 1.0

 Report printed: Tue Aug 3 10:00:01 1993
 Host name: test.austin.ibm.com
 Range of analysis is from:  Hour 16 on Monday, July 5th, 1993
 to: Hour 9 on Tuesday, August 3rd, 1993.

[To disable/modify/enable collection or reporting, execute the pdt_config script]

--------------------- Alerts ---------------------
  I/O BALANCE
   -  Phys. vol. hdisk0 is significantly busier than others
      volume cd0, mean util. = 0.00
      volume hdisk0, mean util. = 11.75
      volume hdisk1, mean util. = 0.00
  PAGE SPACE AND MEMORY
   -  Mean page space used = 46.85 MB
      System has 32MB memory; may be inadequate.
      Consider further investigations to determine if memory is a bottleneck

------------------- Upward Trends ----------------
  FILE SYSTEMS
   -  File system hd2 (/usr) PERCENTAGE FULL
      now, 45.00 % full, and growing an avg. of 2.0 %/day
      At this rate, hd2 will be full in about 15 days
  PAGE SPACE
   -  Page space hd6 USE
      now, 44.80 MB and growing an avg. of 1.81 MB/day
      At this rate, hd6 will be full in about 30 days
  WORKLOAD TRACKING
   - Workload nusers indicator is increasing;
     now 23, and growing an avg. of 1.2 per day

----------------------- System Health ---------------
  SYSTEM HEALTH
   -  Current process state breakdown:
      2.00 [ 3.0 %] : waiting for the cpu
      64.00 [ 97.0 %] : sleeping
      66.00 = TOTAL
      [based on 1 measurement consisting of 10 2-second samples]

------------------ Summary ------------------------
  This is a severity level 2 report
  Further details are available at severity levels > 2
______________________________________________________________________________
In the preceding example, the header section indicates the release number of PDT, the date the report was printed, the host from which the data was collected, and the range of dates of the data that fed the analysis.
The next section, Alerts, indicates suspicious configuration and load conditions. In the example, it appears that, of the three disks on the system, one is getting essentially all of the I/O activity. Clearly, I/O load is not distributed in such a way as to best make use of the available resources. The next message, PAGE SPACE AND MEMORY, suggests that the system may be underconfigured in memory.
The Upward Trends section in the example identifies two possible trends. The first is that the file system on logical volume hd2 (the /usr file system) is growing at an average rate of 2% per day. An estimated date at which the file system will be full is provided, based on an assumption of continued linear growth.
The second trend is the apparent systematic growth in the utilization level of one of the paging areas. Information about its rate of increase and expected fill-date is given. Knowledge of growing file systems and paging spaces approaching their limits is potentially very important (especially if the rate is high or the expected fill-date is imminent), since a full file system or paging space can cause system or application failure.
The third trend is a change in one of the workload indicators. The following indicators are tracked by PDT for trends:
The next section, System Health, uses a number of the workload indicators to assess how processes are spending their time.
The final section of the report (Summary) indicates the selected severity level, and whether or not additional detail can be obtained by changing that level. (The highest severity level is 1, which is the default level reported. The lowest level is 3.)
Any message (excluding header and summary information) occurring in the PDT report should be investigated. The indicated problem should be corrected or an explanation for the condition obtained. Possible responses to specific messages are covered in "Responding to PDT-Report Messages".
PDT is installed through installp as the bos.perf.diag_tool option of the AIX Version 4 BOS licensed program.
PDT must be enabled in order to begin data collection and report writing. PDT is enabled by executing the script /usr/sbin/perf/diag_tool/pdt_config. Only the root userid is permitted to run this script. When executed, the following message is displayed:
# /usr/sbin/perf/diag_tool/pdt_config
 ________________PDT customization menu__________________

1) show current  PDT report recipient and severity level
2) modify/enable PDT reporting
3) disable       PDT reporting
4) modify/enable PDT collection
5) disable       PDT collection
6) de-install    PDT
7) exit pdt_config
Please enter a number:
When you respond with 4, default PDT collection and reporting is enabled. The crontab entry for user adm is updated to add the PDT entries. Actual collection occurs when the cron jobs are run by cron. Respond with 7 to terminate the pdt_config program.
Option 5 should be selected to disable collection.
Certain aspects of PDT can be customized. For example, any user can be designated as the regular recipient of PDT reports, and the retention period for data in PDT's historical record can be modified. All customization is performed either by modifying one of the PDT files in /var/perf/cfg/diag_tool/ or by executing the /usr/sbin/perf/diag_tool/pdt_config script.
We recommend that no changes be made until after PDT has produced several reports, and a certain familiarity with PDT has been acquired.
By default, PDT reports are generated with severity level 1. This means that only the most serious problems are identified. There are other severity levels (2,3) at which more detailed information is frequently available. Further, whenever a PDT report is produced, it is mailed to userid adm . It might be desirable to have the report mailed elsewhere or not mailed at all.
Both of these parameters are controlled with the pdt_config script. The following dialog changes the user and the severity level :
#/usr/sbin/perf/diag_tool/pdt_config
________________PDT customization menu__________________

1) show current  PDT report recipient and severity level
2) modify/enable PDT reporting
3) disable       PDT reporting
4) modify/enable PDT collection
5) disable       PDT collection
6) de-install    PDT
7) exit pdt_config
Please enter a number: 1
current PDT report recipient and severity level
adm 1
________________PDT customization menu__________________

1) show current  PDT report recipient and severity level
2) modify/enable PDT reporting
3) disable       PDT reporting
4) modify/enable PDT collection
5) disable       PDT collection
6) de-install    PDT
7) exit pdt_config
Please enter a number: 2
enter id@host for recipient of report : rsmith
enter severity level for report (1-3): 2
report recipient and severity level
rsmith 2
________________PDT customization menu__________________

1) show current  PDT report recipient and severity level
2) modify/enable PDT reporting
3) disable       PDT reporting
4) modify/enable PDT collection
5) disable       PDT collection
6) de-install    PDT
7) exit pdt_config
Please enter a number: 1
current PDT report recipient and severity level
rsmith 2
________________PDT customization menu__________________

1) show current  PDT report recipient and severity level
2) modify/enable PDT reporting
3) disable       PDT reporting
4) modify/enable PDT collection
5) disable       PDT collection
6) de-install    PDT
7) exit pdt_config
Please enter a number: 7
#
In the preceding example, the recipient is changed to user rsmith , and the severity is changed to 2. This means that user rsmith will receive the PDT report, and that both severity 1 and 2 messages will be included. Note the use of option 1 to determine the current PDT report recipient and report severity level.
To terminate reporting (but allow collection to continue), option 3 is selected, for example:
#/usr/sbin/perf/diag_tool
________________PDT customization menu__________________

1) show current  PDT report recipient and severity level
2) modify/enable PDT reporting
3) disable       PDT reporting
4) modify/enable PDT collection
5) disable       PDT collection
6) de-install    PDT
7) exit pdt_config
Please enter a number: 3
disable PDT reporting done
________________PDT customization menu__________________

1) show current  PDT report recipient and severity level
2) modify/enable PDT reporting
3) disable       PDT reporting
4) modify/enable PDT collection
5) disable       PDT collection
6) de-install    PDT
7) exit pdt_config
Please enter a number: 1
reporting has been disabled (file .reporting.list not found).
________________PDT customization menu__________________

1) show current  PDT report recipient and severity level
2) modify/enable PDT reporting
3) disable       PDT reporting
4) modify/enable PDT collection
5) disable       PDT collection
6) de-install    PDT
7) exit pdt_config
Please enter a number: 7
#
The following lists indicate the possible problems associated with each severity level. Remember that selecting Severity n results in the reporting of all problems of severity less than or equal to n.
As an alternative to using the periodic report, any user can request a current report from the existing data by executing /usr/sbin/perf/diag_tool/pdt_report [SeverityNum]. The report is produced with the given severity (if none is provided, SeverityNum defaults to 1) and written to stdout. Generating a report in this way does not cause any change to the /var/perf/tmp/PDT_REPORT or /var/perf/tmp/PDT_REPORT.last files.
Errors can occur within each of the different PDT components. In general, an error does not terminate PDT. Instead, a message is output to PDT's standard error file: /var/perf/tmp/.stderr, and that phase of processing terminates.
Users experiencing unexpected behavior, such as the PDT report not being produced as expected, should examine /var/perf/tmp/.stderr.
It is not possible to de-install PDT directly using pdt_config, but if option 6 is requested, a message describes the steps necessary to remove PDT from the system:
#/usr/sbin/perf/diag_tool/pdt_config
________________PDT customization menu__________________

1) show current  PDT report recipient and severity level
2) modify/enable PDT reporting
3) disable       PDT reporting
4) modify/enable PDT collection
5) disable       PDT collection
6) de-install    PDT
7) exit pdt_config
Please enter a number: 6
  PDT is installed as package bos.perf.diag_tool in the bos lpp.
  Use the installp facility to remove the package
________________PDT customization menu__________________

1) show current  PDT report recipient and severity level
2) modify/enable PDT reporting
3) disable       PDT reporting
4) modify/enable PDT collection
5) disable       PDT collection
6) de-install    PDT
7) exit pdt_config
Please enter a number: 7
#
PDT analyzes files and directories for systematic growth in size. It examines only those files and directories listed in the file /var/perf/cfg/diag_tool/.files. The format of the .files file is one file/directory name per line. The default content is:
/usr/adm/wtmp
/var/spool/qdaemon/
/var/adm/ras/
/tmp/
You can modify this file with an editor to track files and directories that are important to your system.
PDT tracks the average ping delay to hosts whose names are listed in /var/perf/cfg/diag_tool/.nodes. This file is not shipped with PDT (which means that no host analysis is performed by default), but may be created by the administrator. The format of the .nodes file is one host name per line in the file.
Periodically, a retention shell script is run that discards entries in PDT's historical record that are older than the designated retention period. The retention of all data is governed by the same retention policy. This policy is described in the /var/perf/cfg/diag_tool/.retention.list file. The default .retention.list content is:
* * * 35
which causes all data to be retained no more than 35 days. The number 35 can be replaced by any unsigned integer.
PDT uses the historical record to assess trends and identify system changes. Extending the retention period increases the scope of this analysis at the cost of additional disk storage and PDT processing time.
PDT's historical record is maintained in /var/perf/tmp/.SM. The retention script creates a copy of this file in /var/perf/tmp/.SM.last prior to performing the retention operation. In addition, historical data that is discarded is appended to /var/perf/tmp/.SM.discards.
The existence of /var/perf/tmp/.SM.last provides limited backup, but the administrator should ensure that the /var/perf/tmp/.SM file is regularly backed up. If the file is lost, PDT continues to function, but without the historical information. Over time, the historical record will grow again as new data is collected.
Collection, reporting and retention are driven by three entries in user adm 's cron table. Collection occurs on every weekday at 9 a.m. Reporting occurs every weekday at 10 a.m. The retention analysis is performed once a week, on Saturday evening at 9 p.m. The cron entries (created by executing the /usr/sbin/perf/diag_tool/pdt_config script and selecting option 2) are shown below:
0  9 * * 1-5   /usr/sbin/perf/diag_tool/Driver_ daily
0 10 * * 1-5   /usr/sbin/perf/diag_tool/Driver_ daily2
0 21 * * 6     /usr/sbin/perf/diag_tool/Driver_ offweekly
While it is possible to modify these times by editing adm 's cron table, this is not recommended.
PDT identifies many types of problems. Responses to these indications depends on the individual organization's available resources and set of priorities. The following samples suggest some possibilities:
| Problem: | JFS file system becomes unavailable |
|---|---|
| Response: | Investigate why file system is unavailable. |
| Useful cmds: | lsfs (to determine file system status) |
| Problem: | Apparently too little memory for current workload |
|---|---|
| Response: | If the system is paging heavily, more memory may be required on the system for good performance. |
| Useful cmds: | lsps -a, vmstat |