The operating system is shipped instrumented with key events. The user need only activate trace to capture the flow of events from the operating system. Application developers may want to instrument their application code during development for tuning purposes. This provides them with insight into how their applications are interacting with the system.
To add a trace event you have to design the trace records generated by your program in accordance with trace interface conventions. You then add trace-hook macros to the program at the appropriate locations. Traces can then be taken via any of the standard ways of invoking and controlling trace (commands, subcommands, or subroutine calls). To use the trcrpt program to format your traces, you need to add stanzas describing each new trace record and its formatting requirements to the trace format file.
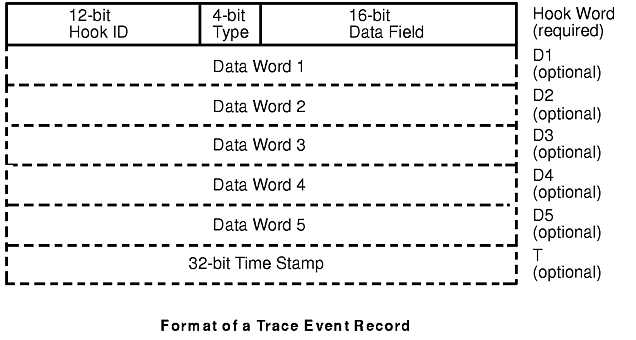
A trace event can take several forms. An event consists of a hook word, optional data words, and an optional time stamp, as shown in the figure "Format of a Trace Event Record". A four-bit type is defined for each form the event record can take. The type field is imposed by the recording routine so that the report facility can always skip from event to event when processing the data, even if the formatting rules in the trace format file are incorrect or missing for that event.
An event record should be as short as possible. Many system events use only the hook word and time stamp. There is another event type that is mentioned but should seldom be used because it is less efficient and is intrusive. It is a long format that allows the user to record a variable length of data. In this long form, the 16-bit data field of the hook word is converted to a length field that describes the length of the event record.
The trace facility can accommodate up to eight simultaneous channels of trace-hook activity, which are numbered 0-7. Channel 0 is always used for system events, but application events can also use it. The other seven channels, called generic channels, can be used for tracing application-program activity.
When trace is started, channel 0 is used by default. A trace -n command (where n is the channel number) starts trace to a generic channel. Use of the generic channels has some limitations.
There is a macro to record each possible type of event record. The macros are defined in /usr/include/sys/trcmacros.h. The event IDs are defined in /usr/include/sys/trchkid.h. These two files should be included by any program that is recording trace events.
The macros to record events on channel 0 with a time stamp are:
Similarly, to record events on channel 0 without a time stamp, use:
The type field of the trace event record is set to the value that corresponds to the macro used, regardless of the value of those 4 bits in the hw parameter.
There are only two macros to record events to one of the generic channels (1-7). These are as follows:
These macros record in the event stream specified by the channel parameter (ch) a hook word (hw), a data word (D1) and len bytes from the user's data segment beginning at the location specified by buf.
The event ID in a trace record identifies that record as belonging to a particular class of records. The event ID is the basis on which the trace mechanism records or ignores trace hooks, as well as the basis on which the trcrpt command includes or excludes trace records in the formatted report.
Event IDs are 12 bits (three hexadecimal digits) for a possible 4096 IDs. Event IDs that are permanently left in and shipped with code are permanently assigned by IBM to avoid duplication. To allow users to define events in their environments or during development, the range of event IDs from hex 010 through hex 0FF has been set aside for temporary use. Users can freely use IDs in this range in their own environment (that is, any set of systems within which the users are prepared to ensure that the same event ID is not used ambiguously).
Attention: It is important that users who make use of this event range do not let the code leave their environment. If you ship code instrumented with temporary hook IDs to an environment in which you do not control the use of IDs, you risk collision with other programs that already use the same IDs in that environment.
Event IDs should be conserved because there are so few of them, but they can be extended by using the 16-bit Data Field. This yields a possible 65536 distinguishable events for every formal hook ID. The only reason to have a unique ID is that an ID is the level at which collection and report filtering are available in the trace facility.
A user-added event can be formatted by the trcrpt command if there is a stanza for the event in the specified trace format file. The trace format file is an editable ASCII file--see "Syntax of Stanzas in the Trace Format File".
The following example shows the use of trace events to time the execution of a program loop:
#include <sys/trcctl.h>
#include <sys/trcmacros.h>
#include <sys/trchkid.h>
char *ctl_file = "/dev/systrctl";
int ctlfd;
int i;
main()
{
  printf("configuring trace collection \n");
  if (trcstart("-ad")){
    perror("trcstart");
    exit(1);
  }
  printf("opening the trace device  \n");
  if((ctlfd = open(ctl_file,0))<0){
    perror(ctl_file);
    exit(1);
  }
  printf("turning  trace on \n");
  if(ioctl(ctlfd,TRCON,0)){
    perror("TRCON");
    exit(1);
  }
  for(i=1;i<11;i++){
    TRCHKL1T(HKWD_USER1,i);

    /* The code being measured goes here. The interval */
    /* between occurrences of HKWD_USER1 in the trace  */
    /* file is the total time for one iteration.       */
  }
  printf("turning trace off\n");
  if(ioctl(ctlfd,TRCSTOP,0)){
    perror("TRCOFF");
    exit(1);
  }

  printf("stopping the trace daemon \n");
  if (trcstop(0)){
    perror("trcstop");
    exit(1);
  }

  exit(0);
}
When you compile the sample program, you need to link to the librts.a library as follows:
$ xlc -O3 sample.c -o sample -l rts
HKWD_USER1 is event ID 010 hexadecimal (you can verify this by looking at /usr/include/sys/trchkid.h). The report facility does not know how to format the HKWD_USER1 event, unless rules are provided in the trace format file. The following example of a stanza for HKWD_USER1 could be used.
# User event HKWD_USER1 Formatting Rules Stanza
# An example that will format the event usage of the sample program
010 1.0 L=APPL "USER EVENT - HKWD_USER1" O2.0      \n \
               "The # of loop iterations =" U4     \n \
               "The elapsed time of the last loop = " \
                endtimer(0x010,0x010) starttimer(0x010,0x010)
When entering the example stanza, do not modify the master format file /etc/trcfmt, but instead make a copy and keep it in your own directory (assume you name it mytrcfmt ). When you run the sample program, the raw event data is captured in the default log file since no other log file was specified to the trcstart subroutine. You probably want to filter the output report to get only your events. To do this, run the trcrpt command as follows:
trcrpt -d 010 -t mytrcfmt -O "exec=on" > sample.rpt
You can browse sample.rpt to see the result.
The intent of the trace format file is to provide rules for presentation and display of the expected data for each event ID. This allows new events to be formatted without changing the report facility. Rules for new events are simply added to the format file. The syntax of the rules provides flexibility in the presentation of the data.
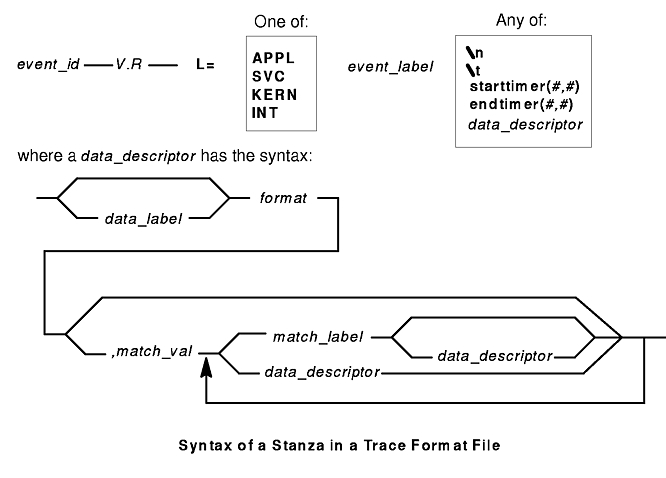
The figure "Syntax of a Stanza in a Trace Format File" illustrates the syntax for a given event. A trace format stanza can be as long as required to describe the rules for any particular event. The stanza can be continued to the next line by terminating the present line with a '\' character. The fields are:
| event_id | Each stanza begins with the three-digit hexadecimal event ID that the stanza describes, followed by a space. |
| V.R | Describes the version (V) and release (R) in which the event was first assigned. Any integers will work for V and R, and users may want to keep their own tracking mechanism. |
| L= | Specifies text indentation level. The text description of an event can begin at various indentation levels. This improves the readability of the report output. The indentation levels correspond to the level at which the system is executing. The recognized levels are application level (APPL), a transitioning system call (SVC), kernel level (KERN), and interrupt (INT). |
| event_label | Specifies an ASCII text string that describes the overall use of the event ID. This is used by the -j option of the trcrpt command to provide a listing of events and their first-level description. The event_label also appears in the formatted output for the event unless the event_label starts with an @ character. |
| \n | The event stanza describes how to parse, label, and present the data contained in an event record. The \n (newline) function can be imbedded in the event stanza to force presentation of the data to a new line. This allows the presentation of the data for an event to be several lines long. |
| \t | Inserts a tab at the point where it is encountered in parsing the description. This is similar to the way the \n function inserts new lines. Spacing can also be inserted by spaces in the data_label or match_label fields. |
| starttimer(timerID), endtimer(timerID) | |
| The timerID is a unique identifier that associates a particular starttimer with a later endtimer that has the same identifier. By (unenforced) convention, the timerID is of the form:
ID of starting event, ID of ending event When the report facility encounters a starttimer directive while parsing an event, it associates the starting event's time with the specified timerID. When an endtimer with the same timerID is encountered, the report facility shows the delta time (in brackets) that elapsed between the starting event and ending event. The begin- and end-system-call events make use of this capability. On the return from a system-call event, a delta time indicates how long the system call took. | |
| data_descriptor | Describes how the data should be consumed, labeled, and presented by the report facility. The syntax of the data_descriptor field is expanded in the second part of the figure "Syntax of a Stanza in a Trace Format File". The various fields of the data_descriptor are described as follows: |
All of the possible format fields are described in the comments of the /etc/trcfmt file. A brief introduction to the possibilities is provided here:
Some macros are provided that can be used as format fields to quickly access data. For example:
This macro causes data word 1 to be accessed but to be considered as 2 bytes and 3 bits of binary data.
The comments in the /etc/trcfmt file describe other format and macro possibilities and describe how a user can define additional macros.