This task will show you how to visualize the displacements of the CATAnalysis according to the restraints and load you assigned to this CATAnalysis. You previously launched the computation of the Static Analysis Case and will now generate a Report with computations of the displacements you are going to perform:
- Displacement
- Stress Von Mises.
-
Click Displacement
 in the Image toolbar.
A plot of the displacement field is displayed with arrow symbols. If you go over the plot with the cursor, you can visualize the nodes. The computed displacement field can now be used to compute other results such as strains, stresses, reaction forces and so forth.
Arrows representing the displacement:
Zoomed arrows:
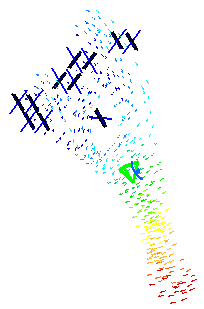
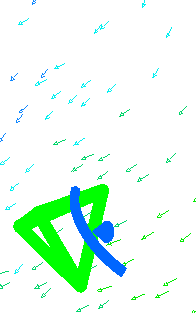
A Translational displacement vector.1 image appears in the specification tree under Static Case Solution.1.
-
Click Stress Von Mises
 in the Image toolbar.
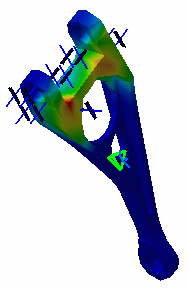

To obtain a better visualization, select View > Render Style > Customize View and make sure the Materials option is selected in the Custom View Modes dialog box.
A Von Mises stress (nodal value).1 image appears in the specification tree under Static Case Solution.1.


As soon you created the Von Mises Stress image, the representation of the Translational Displacement image is deactivated.
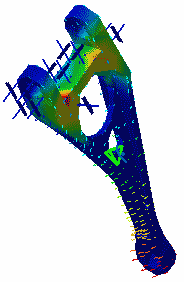
You can choose to have both Translational displacement vector and Von Mises Stress (nodal value) images displayed.
To do this, right-click Translational displacement vector in the specification tree and select Activate/Deactivate .
.
-
Double-click Von Mises Stress (nodal value).1 in the specification tree to edit it.
The Image Edition dialog box appears.

-
Color value: the Color Palette enables you to modify the color distribution and to focus on specific values.
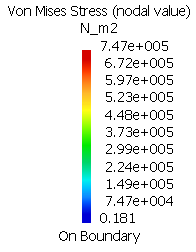
For more details about the color palette, refer to Editing the Color Palette. -
Internal von Mises stress field values
To visualize internal von Mises stress field values in a plane section through the part, click Cut Plane Analysis
 in the Analysis Tools toolbar.
You can handle the compass with the mouse in order to rotate or translate the Cutting Plane (to do so, select an edge of the compass and drag the mouse).
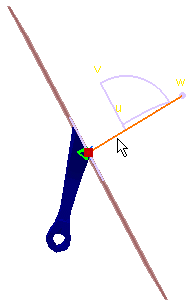
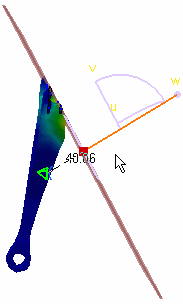
To exit this view, click Close in the Cut Plane Analysis dialog box that appeared.
For more details about this command, refer to Cut Plane Analysis.
-
-
Click Image Extrema
 in the Analysis Tools toolbar to obtain local and global
extrema values of the von Mises stress field magnitude.
in the Analysis Tools toolbar to obtain local and global
extrema values of the von Mises stress field magnitude.The Extrema Creation dialog box appears.
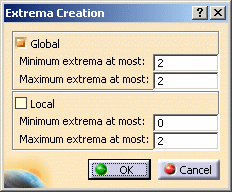
-
Click OK.
In this particular case, you specify that you need two Absolute extrema.
Locations of the global maxima and minima are indicated on the image, and the Extrema object appears in the specification tree under the Static Case Solutions objects set.
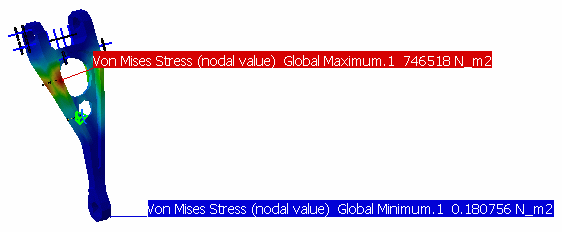
As you can see above, the values are not satisfying for our static case: you need more distributed force so that the Stress Von Mises values might be more significant. You will therefore save the document, modify the values and re-compute the static case in the following task.
![]()