Licensing
-
Click Distance and Band Analysis
 .
.The Edit Distance and Band Analysis dialog box appears. 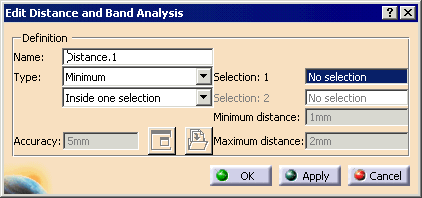

The default distance analysis is measuring the minimum distance inside one selection. -
Find the minimum distance, and click Apply, so that the dialog box remains open.
The Edit Distance and Band Analysis dialog box expands to include a Results area. 
And a preview window appears: 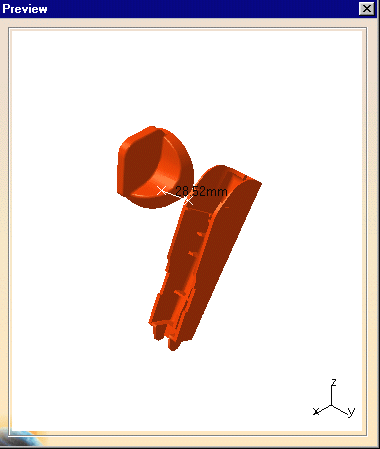
-
From the Type list, select Band Analysis.
-
Set the Minimum and Maximum Distance to define the band width (e.g., to 32 and 36mm respectively).
Default values are 1 and 2mm respectively. -
(Optional) Enter a new Accuracy setting.
The value entered defines the maximum value for the length of the longest side of a triangular representation of the results. This representation is used to obtain the red and green surfaces. The default value is 5mm. A lower value gives you a more accurate result. -
Click Apply.
A progress bar is displayed letting you monitor and, if necessary, interrupt the calculation (by pressing Cancel). 
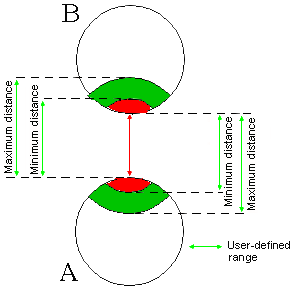
On the preview window, green surfaces identify the areas where the minimum distance between the products is within the specified range. Red surfaces identify the areas where the minimum distance between the products is less than the specified minimum distance. 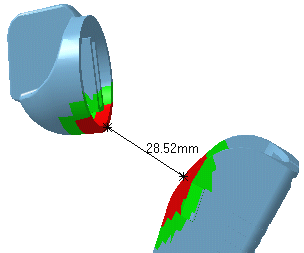
The dialog box expands to include Visualization Filters letting you better visualize the green and red surfaces. 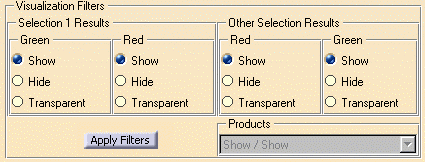
-
Set the appropriate options to show, hide, or make transparent the green and red surfaces corresponding to band analysis results for components in selection 1.
-
Repeat for other components, i.e. those measured against Selection 1, and click Apply Filter.
In the Inside one selection computation type, visualization filters are valid where two products only are selected. In this example, Selection 1 results, which appear in Green, are set to Hide, while the Other Selection results, which appear in Red, are Transparent. 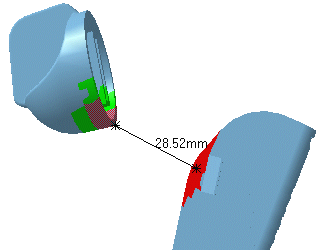
-
Close the preview window and in the Edit Distance and Band Analysis dialog box, click Results Window
 .
. -
In the Products box, select Show/Hide to visualize the results of the band analysis only.
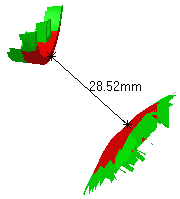
-
Click OK in the Edit Distance and Band Analysis dialog box when done.
-
Use Defining an Analysis Configuration when you are ready to perform this analysis during a simulation or the jog command (depending on your product).