This section contains Xprofiler system requirements, limitations, and information about installing Xprofiler. It also lists the files and directories that are created by installing Xprofiler.
The following are hardware and software requirements for Xprofiler:
Software requirements:
Disk space requirements:
Although it is not required to install Xprofiler on every node, it is advisable to install it on at least one node in each group of nodes that have the same software library levels.
If users plan to collect a gmon.out file on one processor and then use Xprofiler to analyze the data on another processor, they should be aware that some shared (system) libraries may not be the same on the two processors. This situation may result in different function-call tree displays for shared libraries.
There are two methods to install Xprofiler. One method is by using the installp command. The other is by using SMIT.
To install Xprofiler, type:
installp -a -I -X -d device_name xprofiler
To install Xprofiler using SMIT, do the following:
smit install_latestThis command opens the SMIT panel for installing software.
xprofilerin the SOFTWARE to install field and press Enter.
Installing Xprofiler creates the directories and files shown in the following table:
| Directory or file | Description |
|---|---|
|
/usr/lib/nls/msg/En_US/xprofiler.cat /usr/lib/nls/msg/en_US/xprofiler.cat /usr/lib/nls/msg/C/xprofiler.cat |
Message catalog for Xprofiler |
| /usr/xprofiler/defaults/Xprofiler.ad | Defaults file for X-Windows and Motif resource variables |
| /usr/xprofiler/bin/.startup_script | Startup script for Xprofiler |
| /usr/xprofiler/bin/xprofiler | Xprofiler exec file |
| /usr/xprofiler/help/en_US/xprofiler.sdl
/usr/xprofiler/help/en_US/xprofiler_msg.sdl /usr/xprofiler/help/en_US/graphics |
Online help |
| /usr/xprofiler/READMES/xprofiler.README | Installation readme file |
| /usr/xprofiler/samples | Directory containing sample programs |
The following symbolic link is made during the installation process of Xprofiler:
| This link: | To: |
|---|---|
| /usr/lpp/X11/lib/X11/app-defaults/Xprofiler | /usr/xprofiler/defaults/Xprofiler.ad |
| /usr/bin/xprofiler | /usr/xprofiler/bin.startup_script |
To start Xprofiler, enter the xprofiler command on the command line. You must also specify the binary executable file, one or more profile data files, and optionally, one or more flags, which you can do in one of two ways. You can either specify the files and flags on the command line along with the xprofiler command, or you can enter the xprofiler command alone, then specify the files and flags from within the GUI.
You will have more than one gmon.out file if you are profiling a parallel application, because a gmon.out file is created for each task in the application when it is run. If you are running a serial application, there may be times when you want to summarize the profiling results from multiple runs of the application. In these cases, you must specify each of the profile data files you want to profile with Xprofiler.
To start Xprofiler and specify the binary executable file, one or more profile data files, and one or more flags, type:
xprofiler a.out gmon.out... [flag...]
where: a.out is the binary executable file, gmon.out... is the name of your profile data file (or files), and flag... is one or more of the flags listed in the following section on Xprofiler command-line flags.
You can specify the same command-line flags with the xprofiler command that you do with gprof, as well as one additional flag (-disp_max), which is specific to Xprofiler. The command-line flags let you control the way Xprofiler displays the profiled output.
You can specify the flags in Table 2 from the command line or from the Xprofiler GUI (see Specifying command line options (from the GUI) for more information).
| Use this flag: | To: | For example: |
|---|---|---|
| -a | Add alternative paths to search for source code and library files, or changes the current path search order. When using this flag, you can use the "at" symbol (@) to represent the default file path, in order to specify that other paths be searched before the default path. | To set an alternative file search path so that Xprofiler searches pathA, the default path, then pathB, type: xprofiler -a pathA:@:pathB |
| -b | Suppress the printing of the field descriptions for the Flat Profile, Call Graph Profile, and Function Index reports when they are written to a file with the Save As option of the File menu. | Type: xprofiler -b a.out gmon.out |
| -c | Load the specified configuration file. If this flag is used on the command line, the configuration file name specified with it will appear in the Configuration File (-c): text field in Load Files Dialog window and in the Selection field of the Load Configuration File Dialog window. When both the -c and -disp_max flags are specified on the command line, the -disp_max flag is ignored, but the value that was specified with it will appear in the Initial Display (-disp_max): field in the Load Files Dialog window the next time this window is opened. | To load the configuration file myfile.cfg, type: xprofiler a.out gmon.out -c myfile.cfg |
| -disp_max | Set the number of function boxes that Xprofiler initially displays in the function call tree. The value supplied with this flag can be any integer between 0 and 5000. Xprofiler displays the function boxes for the most CPU-intensive functions through the number you specify. For example, if you specify 50, Xprofiler displays the function boxes for the 50 functions in your program with the highest CPU usage. After this, you can change the number of function boxes that are displayed using the Filter menu options. This flag has no effect on the content of any of the Xprofiler reports. | To display the function boxes for the 50 most CPU-intensive functions in the function call tree, type: xprofiler -disp_max 50 a.out gmon.out |
| -e | Deemphasize the general appearance of the function box for the specified
function in the function call tree, and limits the number of entries for this
function in the Call Graph Profile report. This also
applies to the specified function's descendants, as long as they have not
been called by non-specified functions.
In the function call tree, the function box for the specified function is made unavailable. The box size and the content of the label remain the same. This also applies to descendant functions, as long as they have not been called by non-specified functions. In the Call Graph Profile report, an entry for a specified function only appears where it is a child of another function, or as a parent of a function that also has at least one non-specified function as its parent. The information for this entry remains unchanged. Entries for descendants of the specified function do not appear unless they have been called by at least one non-specified function in the program. |
To deemphasize the appearance of the function boxes for foo and bar and their qualifying descendants in the function call tree, and limit their entries in the Call Graph Profile report, type: xprofiler -e foo -e bar a.out gmon.out |
| -E | Change the general appearance and label information of the function
box for the specified function in the function call tree. This flag also
limits the number of entries for this function in the Call
Graph Profile report, and changes the CPU data associated with them.
These results also apply to the specified function's descendants, as long
as they have not been called by non-specified functions in the program.
In the function call tree, the function box for the specified function is made unavailable, and the box size and shape also changes so that it appears as a square of the smallest allowable size. In addition, the CPU time shown in the function box label, appears as 0. The same applies to function boxes for descendant functions, as long as they have not been called by non-specified functions. This flag also causes the CPU time spent by the specified function to be deducted from the CPU total on the left in the label of the function box for each of the specified function's ancestors. In the Call Graph Profile report, an entry for the specified function only appears where it is a child of another function, or as a parent of a function that also has at least one non-specified function as its parent. When this is the case, the time in the self and descendants columns for this entry is set to 0. In addition, the amount of time that was in the descendants column for the specified function is subtracted from the time listed under the descendants column for the profiled function. As a result, be aware that the value listed in the % time column for most profiled functions in this report will change. |
To change the display and label information for foo and bar, as well as their qualifying descendants in the function call tree, and limit their entries and data in the Call Graph Profile report, type: xprofiler -E foo -E bar a.out gmon.out |
| -f | Deemphasize the general appearance of all function boxes in the function
call tree, except for that of the specified function
and its descendants. In addition, the number of entries in the Call Graph
Profile report for the non-specified functions and non-descendant functions
is limited. The -f flag overrides the -e flag.
In the function call tree, all function boxes except for that of the specified function and its descendants are made unavailable. The size of these boxes and the content of their labels remain the same. For the specified function and its descendants, the appearance of the function boxes and labels remain the same. In the Call Graph Profile report, an entry for a non-specified or non-descendant function only appears where it is a parent or child of a specified function or one of its descendants. All information for this entry remains the same. |
To deemphasize the display of function boxes for all functions in the function call tree except for foo, bar, and their descendants, and limit their types of entries in the Call Graph Profile report, type: xprofiler -f foo -f bar a.out gmon.out |
| -F | Change the general appearance and label information of all function
boxes in the function call tree except for that of
the specified function and its descendants. In addition, the number of entries
in the Call Graph Profile report for the non-specified and non-descendant
functions is limited, and the CPU data associated with them is changed.
The -F flag overrides the -E flag.
In the function call tree, the function box for the specified function are made unavailable, and its size and shape also changes so that it appears as a square of the smallest allowable size. In addition, the CPU time shown in the function box label, appears as 0. In the Call Graph Profile report, an entry for a non-specified or non-descendant function only appears where it is a parent or child of a specified function or one of its descendants. When this is the case, the time in the self and descendants columns for this entry is set to 0. As a result, be aware that the value listed in the % time column for most profiled functions in this report will change. |
To change the display and label information of the function boxes for all functions except the functions foo and bar and their descendants, and limit their types of entries and data in the Call Graph Profile report, type: xprofiler -F foo -F bar a.out gmon.out |
| -h | -? | Display the xprofiler command's usage statement. |
xprofiler -hUsage: xprofiler [program] [-b] [-h] [-s] [-z] [-a path(s)] [-c file] [-L pathname] [[-e function]...] [[-E function]...] [[-f function]...] [[-F function]...] [-disp_max number_of_functions] [[gmon.out]...] |
| -L | Specify an alternative path name for locating shared libraries. If you plan to specify multiple paths, use the Set File Search Path option of the File menu on the Xprofiler GUI. See Setting the file search sequence for more information. | To specify /lib/profiled/libc.a:shr.o as an alternative path name for your shared libraries, type: xprofiler -L /lib/profiled/libc.a:shr.o |
| -s | Produce the gmon.sum profile data file (if multiple gmon.out files are specified when Xprofiler is started). The gmon.sum file represents the sum of the profile information in all the specified profile files. Note that if you specify a single gmon.out file, the gmon.sum file contains the same data as the gmon.out file. | To write the sum of the data from three profile data files, gmon.out.1, gmon.out.2, and gmon.out.3, into a file called gmon.sum, type: xprofiler -s a.out gmon.out.1 gmon.out.2 gmon.out.3 |
| -z | Include functions that have both zero CPU usage and no call counts in the Flat Profile, Call Graph Profile, and Function Index reports. A function will not have a call count if the file that contains its definition was not compiled with the -pg flag, which is common with system library files. | To include all functions used by the application that have zero CPU usage and no call counts in the Flat Profile, Call Graph Profile, and Function Index reports, type: xprofiler -z a.out gmon.out |
After you enter the xprofiler command, the Xprofiler main window appears and displays your application's data.
If you enter the xprofiler command on its own, you can then specify an executable file, one or more profile data file, and any flags, from within the Xprofiler GUI. You use the Load File option of the File menu to do this.
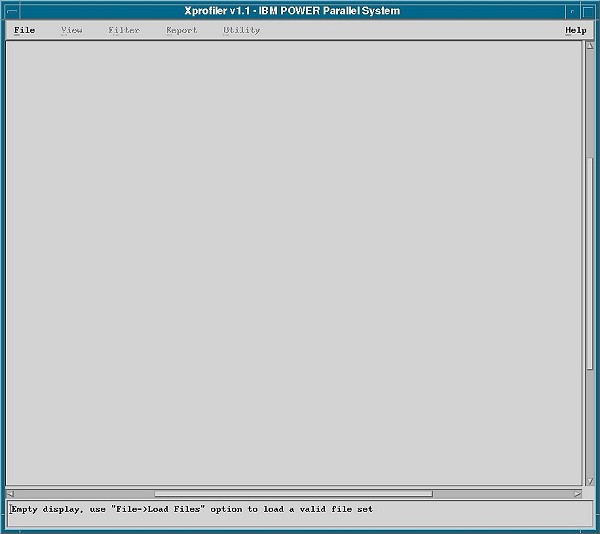
When you enter the xprofiler command alone, the Xprofiler main window appears. Because you did not load an executable file or specify a profile data file, the window will be empty.
If you enter the xprofiler -h or xprofiler -? command, Xprofiler displays the usage statement for the command and then exits.
From the Xprofiler GUI, select File, then Load File from the menu bar. The Load Files Dialog window will appear.
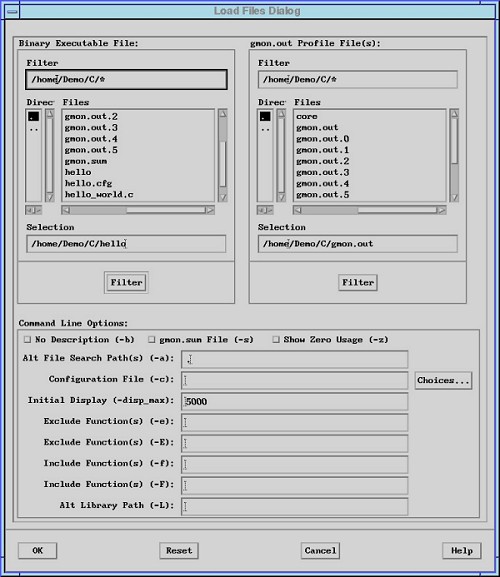
The Load Files Dialog window lets you specify your application's executable file and its corresponding profile data (gmon.out) files. When you load a file, you can also specify the various command-line options that let you control the way Xprofiler displays the profiled data.
To load the files for the application you want to profile, you must specify the following:
Optionally, you can also specify one or more command-line flags.
You specify the binary executable file from the Binary Executable File: area of the Load Files Dialog window.
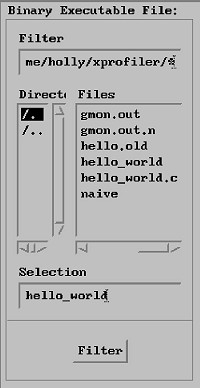
Use the scroll bars of the Directories and Files selection boxes to locate the executable file you want to load. By default, all of the files in the directory from which you called Xprofiler appear in the Files selection box.
To make locating your binary executable files easier, the Binary Executable File: area includes a Filter button. Filtering lets you limit the files that are displayed in the Files selection box to those of a specific directory or of a specific type. For information about filtering, see Filtering what you see.
You specify one or more profile data files from the gmon.out Profile Data File(s) area of the Load Files Dialog window.

When you start Xprofiler using the xprofiler command, you are not required to indicate the name of the profile data file. If you do not specify a profile data file, Xprofiler searches your directory for the presence of a file named gmon.out and, if found, places it in the Selection field of the gmon.out Profile Data File(s) area, as the default. Xprofiler then uses this file as input, even if it is not related to the binary executable file you specify. Because this will cause Xprofiler to display incorrect data, it is important that you enter the correct file into this field. If the profile data file you want to use is named something other than what appears in the Selection field, you must replace it with the correct file name.
Use the scroll bars of the Directories and Files selection boxes to locate one or more of the profile data (gmon.out) files you want to specify. The file you use does not have to be named gmon.out, and you can specify more than one profile data file.
To make locating your output files easier, the gmon.out Profile Data File(s) area includes a Filter button. Filtering lets you limit the files that are displayed in the Files selection box to those in a specific directory or of a specific type. For information about filtering, see Filtering what you see.
You specify command-line flags from the Command Line Options area of the Load Files Dialog window.
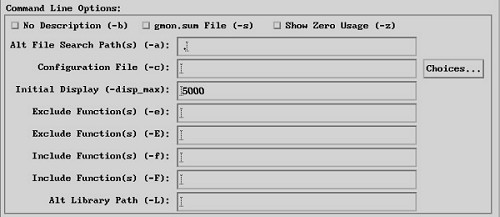
You can specify one or more flags as follows:
| Use this flag: | To: | For example: |
|---|---|---|
| -a (field) | Add alternative paths to search for source code and library files,
or changes the current path search order. After clicking the OK button,
any modifications to this field are also made to the Enter Alt File Search
Paths: field of the Alt File Search Path Dialog window. If both the
Load Files Dialog window and the Alt File Search Path Dialog window are opened
at the same time, when you make path changes in the Alt File Search Path Dialog
window and click OK, these changes are also made to the Load Files
Dialog window. Also, when both of these windows are open at the same time,
clicking the OK or Cancel buttons in the Load Files Dialog
window causes both windows to close. If you want to restore the Alt File
Search Path(s) (-a): field to the same state as when the Load Files Dialog
window was opened, click the Reset button.
You can use the "at" symbol (@) with this flag to represent the default file path, in order to specify that other paths be searched before the default path. |
To set an alternative file search path so that Xprofiler searches pathA, the default path, then pathB, type pathA:@:pathB in the Alt File Search Path(s) (-a) field. |
| -b (button) | Suppress the printing of the field descriptions for the Flat Profile, Call Graph Profile, and Function Index reports when they are written to a file with the Save As option of the File menu. | To suppress printing of the field descriptions for the Flat Profile, Call Graph Profile, and Function Index reports in the saved file, set the -b button to the pressed-in position. |
| -c (field) | Load the specified configuration file. If the -c option was used on the command line, or a configuration file had been previously loaded with the Load Files Dialog window or the Load Configuration File Dialog window, the name of the most recently loaded file will appear in the Configuration File (-c): text field in the Load Files Dialog window, as well as the Selection field of Load Files Dialog window. If the Load Files Dialog window and the Load Files Dialog window are open at the same time, when you specify a configuration file in the Load Configuration File Dialog window and then click the OK button, the name of the specified file also appears in the Load Files Dialog window. Also, when both of these windows are open at the same time, clicking the OK or Cancel button in the Load Files Dialog window causes both windows to close. When entries are made to both the Configuration File (-c): and Initial Display (-disp_max): fields in the Load Files Dialog window, the value in the Initial Display (-disp_max): field is ignored, but is retained the next time this window is opened. If you want to retrieve the file name that was in the Configuration File (-c): field when the Load Files Dialog window was opened, click the Reset button. | To load the configuration file myfile.cfg, type myfile.cfg in the Configuration File (-c) field. |
| -disp_max (field) | Set the number of function boxes that Xprofiler initially displays in the function call tree. The value supplied with this flag can be any integer between 0 and 5000. Xprofiler displays the function boxes for the most CPU-intensive functions through the number you specify. For example, if you specify 50, Xprofiler displays the function boxes for the 50 functions in your program with the highest CPU usage. After this, you can change the number of function boxes that are displayed using the Filter menu options. This flag has no effect on the content of any of the Xprofiler reports. | To display the function boxes for the 50 most CPU-intensive functions in the function call tree, type 50 in the Init Display (-disp_max) field. |
| -e (field) | Deemphasize the general appearance of the function box for the specified
function in the function call tree, and limits the number of entries for this
function in the Call Graph Profile report. This also applies to
the specified function's descendants, as long as they have not been called
by non-specified functions.
In the function call tree, the function box for the specified function is made unavailable. The box size and the content of the label remain the same. This also applies to descendant functions, as long as they have not been called by non-specified functions. In the Call Graph Profile report, an entry for a specified function only appears where it is a child of another function, or as a parent of a function that also has at least one non-specified function as its parent. The information for this entry remains unchanged. Entries for descendants of the specified function do not appear unless they have been called by at least one non-specified function in the program. |
To deemphasize the appearance of the function boxes for foo and bar and their qualifying descendants in the function call tree, and
limit their entries in the Call Graph Profile report, type foo and bar in the Exclude Routines (-e) field.
Multiple functions are separated by a space. |
| -E (field) | Change the general appearance and label information of the function
box for the specified function in the function call tree. This flag also
limits the number of entries for this function in the Call Graph Profile report, and changes the CPU data associated with them. These results
also apply to the specified function's descendants, as long as they have not
been called by non-specified functions in the program.
In the function call tree, the function box for the specified function appears greyed out, and the box size and shape also changes so that it appears as a square of the smallest allowable size. In addition, the CPU time shown in the function box label, appears as 0. The same applies to function boxes for descendant functions, as long as they have not been called by non-specified functions. This flag also causes the CPU time spent by the specified function to be deducted from the CPU total on the left in the label of the function box for each of the specified function's ancestors. In the Call Graph Profile report, an entry for the specified function only appears where it is a child of another function, or as a parent of a function that also has at least one non-specified function as its parent. When this is the case, the time in the self and descendants columns for this entry is set to 0. In addition, the amount of time that was in the descendants column for the specified function is subtracted from the time listed under the descendants column for the profiled function. As a result, be aware that the value listed in the % time column for most profiled functions in this report will change. |
To change the display and label information for foo and bar and their qualifying descendants in the function call tree, and
limit their entries and data in the Call Graph Profile report,
type foo bar in the Exclude Routines (-E) field.
You specify multiple functions by separating each one with a space. |
| -f (field) | Deemphasize the general appearance of all function boxes in the function
call tree, except for that of the specified function
and its descendants. In addition, the number of entries in the Call Graph
Profile report for the non-specified functions and non-descendant functions
is limited. The -f flag overrides the -e flag.
In the function call tree, all function boxes except for that of the specified function and its descendants are made unavailable. The size of these boxes and the content of their labels remain the same. For the specified function and its descendants, the appearance of the function boxes and labels remain the same. In the Call Graph Profile report, an entry for a non-specified or non-descendant function only appears where it is a parent or child of a specified function or one of its descendants. All information for this entry remains the same. |
To deemphasize the display of function boxes for all functions in the
function call tree except for foo and bar and their descendants, and limit their types of entries in the Call Graph Profile report, type foo bar in the Include
Routines (-f) field.
You specify multiple functions by separating each one with a space. |
| -F (field) | Change the general appearance and label information of all function
boxes in the function call tree except for that of
the specified function and its descendants. In addition, the number of entries
in the Call Graph Profile report for the non-specified and non-descendant
functions is limited, and the CPU data associated with them is changed.
The -F flag overrides the -E flag.
In the function call tree, the function box for the specified function is made unavailable, and its size and shape also changes so that it appears as a square of the smallest allowable size. In addition, the CPU time shown in the function box label, appears as 0. In the Call Graph Profile report, an entry for a non-specified or non-descendant function only appears where it is a parent or child of a specified function or one of its descendants. When this is the case, the time in the self and descendants columns for this entry is set to 0. As a result, be aware that the value listed in the % time column for most profiled functions in this report will change. |
To change the display and label information of the function boxes
for all functions except the functions foo and bar and their descendants, and limit their types of entries and data
in the Call Graph Profile report, type foo bar in the Include Routines (-F) field.
You specify multiple functions by separating each one with a space. |
| -L (field) | Set the alternative path name for locating shared objects. If you plan to specify multiple paths, use the Set File Search Path option of the File menu on the Xprofiler GUI. See Setting the file search sequence for information. | To specify /lib/profiled/libc.a:shr.o as an alternative path name for your shared libraries, type /lib/profiled/libc.a:shr.o in this field. |
| -s (button) | Produces the gmon.sum profile data file, if multiple gmon.out files are specified when Xprofiler is started. The gmon.sum file represents the sum of the profile information in all the specified profile files. Note that if you specify a single gmon.out file, the gmon.sum file contains the same data as the gmon.out file. | To write the sum of the data from three profile data files, gmon.out.1, gmon.out.2, and gmon.out.3, into a file called gmon.sum, set the -s button to the pressed-in position. |
| -z (button) | Includes functions that have both zero CPU usage and no call counts in the Flat Profile, Call Graph Profile, and Function Index reports. A function will not have a call count if the file that contains its definition was not compiled with the -pg flag, which is common with system library files. | To include all functions used by the application that have zero CPU usage and no call counts in the Flat Profile, Call Graph Profile, and Function Index reports, set the -z button to the pressed-in position. |
After you have specified the binary executable file, one or more profile data files, and any command-line flags you want to use, click the OK button to save the changes and close the window. Xprofiler loads your application and displays its performance data.
You can specify where you want Xprofiler to look for your library files and source code files by using the Set File Search Paths option of the File menu. By default, Xprofiler searches the default paths first and then any alternative paths you specify.
For library files, Xprofiler uses the paths recorded in the specified gmon.out files. If you use the -L flag, the path you specify with it will be used instead of those in the gmon.out files.
For source code files, the paths recorded in the specified a.out file are used.
You specify the alternative paths with the Set File Search Paths option of the File menu.
For library files, if everything else failed, the search will be extended to the path (or paths) specified by the LIBPATH environment variable associated with the executable file.
To specify alternative paths, do the following:
You can change the order of the search sequence for library files and source code files using the Set File Search Paths option of the File menu. To change the search sequence:
To return the search sequence back to its default order, repeat steps 1 through 3, but in step 2, click the Check default path(s) first button. When the action is confirmed (by clicking OK), the search sequence will start with the default paths again.
If a file is found in one of the alternative paths or a path in LIBPATH, this path now becomes the default path for this file throughout the current Xprofiler session (until you exit this Xprofiler session or load a new set of data).
The primary difference between Xprofiler and the gprof command is that Xprofiler gives you a graphical picture of your application's CPU consumption in addition to textual data.
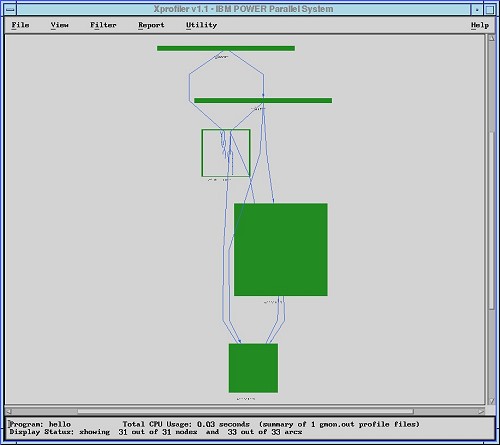
Xprofiler displays your profiled program in a single main window. It uses several types of graphical images to represent the relevant parts of your program. Functions appear as solid green boxes (called function boxes), and the calls between them appear as blue arrows (called call arcs). The function boxes and call arcs that belong to each library within your application appear within a fenced-in area called a cluster box.
The Xprofiler main window contains a graphical representation of the functions and calls within your application as well as their interrelationships. The window provides six menus, including one for online help.
When an application has been loaded, the Xprofiler main window looks similar to the following:
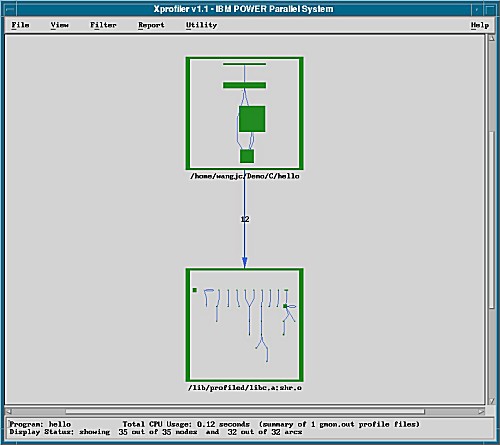
In the main window, Xprofiler displays the function call tree. The function call tree displays the function boxes, call arcs, and cluster boxes that represent the functions within your application.
The Xprofiler menus are as follows:
The File menu lets you specify the executable (a.out) files and profile data (gmon.out) files that Xprofiler will use. It also lets you control how your files are accessed and saved.
The View menu lets you focus on specific portions of the function call tree in order to get a better view of the application's critical areas.
The Filter menu lets you add, remove, and change specific parts of the function call tree. By controlling what Xprofiler displays, you can focus on the objects that are most important to you.
The Report menu provides several types of profiled data in a textual and tabular format. In addition to presenting the profiled data, the options of the Report menu let you do the following:
The Utility menu contains one option, Locate Function By Name, which lets you highlight a particular function in the function call tree.
The Function menu lets you perform a number of operations for any of the functions shown in the function call tree. You can access statistical data, look at source code, and control which functions are displayed.
The Function menu is not visible from the Xprofiler window. You access it by right-clicking on the function box of the function in which you are interested. By doing this, you open the Function menu, and select this function as well. Then, when you select actions from the Function menu, the actions are applied to this function.
The Arc menu lets you locate the caller and callee functions for a particular call arc. A call arc is the representation of a call between two functions within the function call tree.
The Arc menu is not visible from the Xprofiler window. You access it by right-clicking on the call arc in which you are interested. By doing this, you open the Arc menu, and select that call arc as well. Then, when you perform actions with the Arc menu, they are applied to that call arc.
The Cluster Node menu lets you control the way your libraries are displayed by Xprofiler. To access the Cluster Node menu, the function boxes in the function call tree must first be clustered by library. For information about clustering and unclustering the function boxes of your application, see Clustering libraries . When the function call tree is clustered, all the function boxes within each library appear within a cluster box.
The Cluster Node menu is not visible from the Xprofiler window. You access it by right-clicking on the edge of the cluster box in which you are interested. By doing this, you open the Cluster Node menu, and select that cluster as well. Then, when you perform actions with the Cluster Node menu, they are applied to the functions within that library cluster.
At the bottom of the Xprofiler window is a single field that provides the following information:
Functions are represented by solid green boxes in the function call tree. The size and shape of each function box indicates its CPU usage. The height of each function box represents the amount of CPU time it spent on executing itself. The width of each function box represents the amount of CPU time it spent executing itself, plus its descendant functions.
This type of representation is known as summary mode. In summary mode, the size and shape of each function box is determined by the total CPU time of multiple gmon.out files used on that function alone, and the total time used by the function and its descendant functions. A function box that is wide and flat represents a function that uses a relatively small amount of CPU on itself (it spends most of its time on its descendants). The function box for a function that spends most of its time executing only itself will be roughly square-shaped.
Functions can also be represented in average mode. In average mode, the size and shape of each function box is determined by the average CPU time used on that function alone, among all loaded gmon.out files, and the standard deviation of CPU time for that function among all loaded gmon.out files. The height of each function node represents the average CPU time, among all the input gmon.out files, used on the function itself. The width of each node represents the standard deviation of CPU time, among the gmon.out files, used on the function itself. The average mode representation is available only when more than one gmon.out file is entered. For more information about summary mode and average mode, see Controlling the representation of the function call tree.
Under each function box in the function call tree is a label that contains the name of the function and related CPU usage data. For information about the function box labels, see Obtaining basic data.
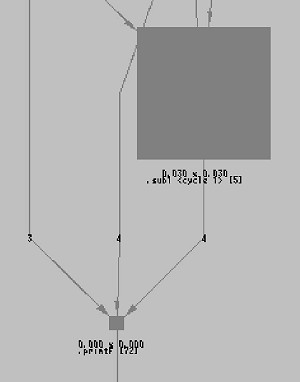
The following figure shows the function boxes for two functions, sub1 and printf, as they would appear in the Xprofiler display.
Each function box has its own menu. To access it, place your mouse cursor over the function box of the function you are interested in and press the right mouse button. Each function also has an information box that lets you get basic performance numbers quickly. To access the information box, place your mouse cursor over the function box of the function you are interested in and press the left mouse button.
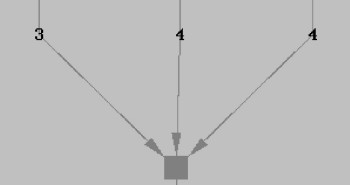
The calls made between each of the functions in the function call tree are represented by blue arrows extending between their corresponding function boxes. These lines are called call arcs. Each call arc appears as a solid blue line between two functions. The arrowhead indicates the direction of the call; the function represented by the function box it points to is the one that receives the call. The function making the call is known as the caller, while the function receiving the call is known as the callee.
Each call arc includes a numeric label that indicates how many calls were exchanged between the two corresponding functions.
Each call arc has its own menu that lets you locate the function boxes for its caller and callee functions. To access it, place your mouse cursor over the call arc for the call in which you are interested, and press the right mouse button. Each call arc also has an information box that shows you the number of times the caller function called the callee function. To access the information box, place your mouse cursor over the call arc for the call in which you are interested, and press the left mouse button.
Xprofiler lets you collect the function boxes and call arcs that belong to each of your shared libraries into cluster boxes.
Because there will be a box around each library, the individual function boxes and call arcs will be difficult to see. If you want to see more detail, you must uncluster the function boxes. To do this, select the Filter menu and then the Uncluster Functions option.
When viewing function boxes within a cluster box, note that the size of each function box is relative to those of the other functions within the same library cluster. On the other hand, when all the libraries are unclustered, the size of each function box is relative to all the functions in the application (as shown in the function call tree).
Each library cluster has its own menu that lets you manipulate the cluster box. To access it, place your mouse cursor over the edge of the cluster box you are interested in, and press the right mouse button. Each cluster also has an information box that shows you the name of the library and the total CPU usage (in seconds) consumed by the functions within it. To access the information box, place your mouse cursor over the edge of the cluster box you are interested in and press the left mouse button.
The Utility menu of the Overview Window lets you choose the mode in which the display is updated. The default is the Immediate Update option, which causes the display to show you the items in the highlight area as you are moving it around. The Delayed Update option, on the other hand, causes the display to be updated only when you have moved the highlight area over the area in which you are interested, and released the mouse button. The Immediate Update option applies only to what you see when you move the highlight area; it has no effect on the resizing of items in highlight area, which is always delayed.
Xprofiler lets you change the way it displays the function call tree, based on your personal preferences.
You can choose between two-dimensional and three-dimensional function boxes in the function call tree. The default style is two-dimensional. To change to three-dimensional, select the View menu, and then the 3-D Image option. The function boxes in the function call tree now appear in three-dimensional format.
You can choose to have Xprofiler display the function call tree in either top-to-bottom or left-to-right format. The default is top-to-bottom. To see the function call tree displayed in left-to-right format, select the View menu, and then the Layout: Left->Right option. The function call tree now displays in left-to-right format.
You can choose to have Xprofiler represent the function call tree in either summary mode or average mode.
When you select the Summary Mode option of the View menu, the size and shape of each function box is determined by the total CPU time of multiple gmon.out files used on that function alone, and the total time used by the function and its descendant functions. The height of each function node represents the total CPU time used on the function itself. The width of each node represents the total CPU time used on the function and its descendant functions. When the display is in summary mode, the Summary Mode option is unavailable and the Average Mode option is activated.
When you select the Average Mode option of the View menu, the size and shape of each function box is determined by the average CPU time used on that function alone, among all loaded gmon.out files, and the standard deviation of CPU time for that function among all loaded gmon.out files. The height of each function node represents the average CPU time, among all the input gmon.out files, used on the function itself. The width of each node represents the standard deviation of CPU time, among the gmon.out files, used on the function itself.
The purpose of average mode is to reveal workload balancing problems when an application is involved with multiple gmon.out files. In general, a function node with large standard deviation has a wide width, and a node with small standard deviation has a slim width.
Both summary mode and average mode affect only the appearance of the function call tree and the labels associated with it. All the performance data in Xprofiler reports and code displays are always summary data. If only one gmon.out file is specified, Summary Mode and Average Mode will be unavailable, and the display is always in Summary Mode.
When Xprofiler first opens, the entire function call tree appears in the main window. This includes the function boxes and call arcs that belong to your executable file as well as the shared libraries that it uses. You can simplify what you see in the main window, and there are several ways to do this.
Xprofiler allows you to undo operations that involve adding or removing nodes and arcs from the function call tree. When you undo an operation, you reverse the effect of any operation which adds or removes function boxes or call arcs to the function call tree. When you select the Undo option, the function call tree is returned to its appearance just prior to the performance of the add or remove operation. To undo an operation, select the Filter menu, and then the Undo option. The function call tree is returned to its appearance just prior to the performance of the add or remove operation.
Whenever you invoke the Undo option, the function call tree loses its zoom focus and zooms all the way out to reveal the entire function call tree in the main display. When you start Xprofiler, the Undo option is unavailable. It is activated only after an add or remove operation involving the function call tree takes place. After you undo an operation, the option is made unavailable again until the next add or remove operation takes place.
The options that activate the Undo option include the following:
If a dialog, such as the Load Configuration Dialog or the Filter by CPU Time Dialog is invoked and then canceled immediately, the status of the Undo option is not affected. After the option is available, it stays that way until you invoke it, or a new set of files is loaded into Xprofiler through the Load Files Dialog window.
When you first open Xprofiler, by default, all the function boxes and call arcs of your executable and its shared libraries appear in the main window. After that, you may choose to filter out specific items from the window. However, there may be times when you want to see the entire function call tree again, without having to reload your application. To do this, select the Filter menu, and then the Show Entire Call Tree option. Xprofiler erases whatever is currently displayed in the main window and replaces it with the entire function call tree.
There are a number of ways that Xprofiler lets you control the items that display in the main window. You will want to include or exclude certain objects so that you can more easily focus on the things that are of most interest to you.
In most cases, your application will call functions that are within shared libraries. By default, these shared libraries display in the Xprofiler window along with your executable file. As a result, the window may get crowded and obscure the items that you most need to see. If this is the case, you can filter the shared libraries from the display. To do this, select the Filter menu, and then the Remove All Library Calls option.
The shared library function boxes disappear from the function call tree, leaving only the function boxes of your executable file visible.
If you removed the library calls from the display, you may want to restore them. To do this, select the File menu and then the Add Library Calls option.
The function boxes again appear with the function call tree. Note, however, that all of the shared library calls that were in the initial function call tree may not be added back. This is because the Add Library Calls option only adds back in the function boxes for the library functions that were called by functions that are currently displayed in the Xprofiler window.
To add only specific function boxes back into the display, do the following:
If there are multiple functions in your program that include the string you enter in their names, the filter applies to each one. For example, if you specified sub and print, and your program also included functions named sub1, psub1, and printf. The sub, sub1, psub1, print, and printf functions would all be added to the graph.
The Filter menu of Xprofiler offers the following options that allow you to add or subtract function boxes from the main window, based on specific characteristics:
Each option uses a different window to let you specify the criteria by which you want to include or exclude function boxes from the window.
To filter by function names, do the following:
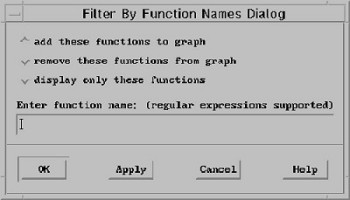
You can enter more than one function name in this field. If there are multiple functions in your program that include the string you enter in their names, the filter will apply to each one. For example, if you specified sub and print, and your program also included functions named sub1, psub1, and printf, the option you chose would be applied to the sub, sub1, psub1, print, and printf functions.
To filter by CPU time, do the following:
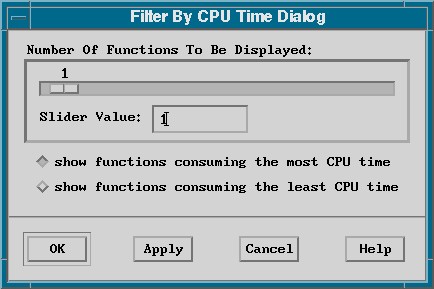
For example, to display the function boxes for the 10 functions in your application that consumed the most CPU, you would select the show functions consuming the most CPU button, and specify 10 with the slider or enter the value 10 in the text field.
To filter by call counts, do the following:
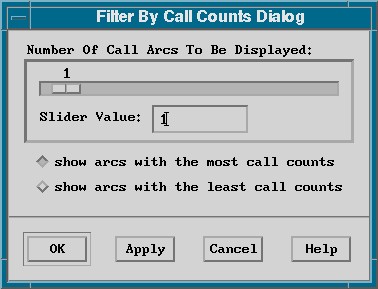
For example, to display the 10 call arcs in your application that represented the least number of calls, you would select the show arcs with the least call counts button, and specify 10 with the slider or enter the value 10 in the text field.
When tuning the performance of your application, you will want to know which functions consumed the most CPU time, and then you will need to ask several questions in order to understand their behavior:
After you understand how these functions behave, and are able to improve their performance, you can proceed to analyzing the functions that consume less CPU.
When your application is large, the function call tree will also be large. As a result, the functions that are the most CPU-intensive may be difficult to see in the function call tree. To avoid this situation, use the Filter by CPU option of the Filter menu, which lets you display only the function boxes for the functions that consume the most CPU time. After you have done this, the Function menu for each function lets you add the parent and descendant function boxes to the function call tree. By doing this, you create a smaller, simpler function call tree that displays the function boxes associated with the most CPU-intensive area of the application.
A child function is one that is directly called by the function of interest. To see only the function boxes for the function of interest and its child functions, do the following:
Xprofiler erases the current display and replaces it with only the function boxes for the function you chose, as well as its child functions.
A parent function is one that directly calls the function of interest. To see only the function box for the function of interest and its parent functions, do the following:
Xprofiler erases the current display and replaces it with only the function boxes for the function you chose, as well as its parent functions.
You might want to view the function boxes for both the parent and child functions of the function in which you are interested, without erasing the rest of the function call tree. This is especially true if you chose to display the function boxes for two or more of the most CPU-intensive functions with the Filter by CPU option of the Filter menu (you suspect that more than one function is consuming too much CPU). Do the following:
Xprofiler leaves the current display as it is, but adds the parent function boxes.
Xprofiler leaves the current display as it is, but now adds the child function boxes in addition to the parents.
When you first open the Xprofiler window, by default, the function boxes of your executable file, and the libraries associated with it, are clustered. Because Xprofiler shrinks the call tree of each library when it places it in a cluster, you must uncluster the function boxes if you want to look closely at a specific function box label.
You can see much more detail for each function, when your display is in the unclustered or expanded state, than when it is in the clustered or collapsed state. Depending on what you want to do, you must cluster or uncluster (collapse or expand) the display.
The Xprofiler window can be visually crowded, especially if your application calls functions that are within shared libraries; function boxes representing your executable functions as well as the functions of the shared libraries are displayed. As a result, you may want to organize what you see in the Xprofiler window so you can focus on the areas that are most important to you. You can do this by collecting all the function boxes of each library into a single area, known as a library cluster.
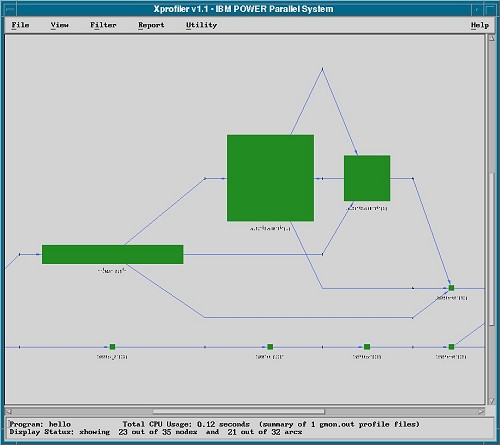
The following figure shows the hello_world application with its function boxes unclustered.
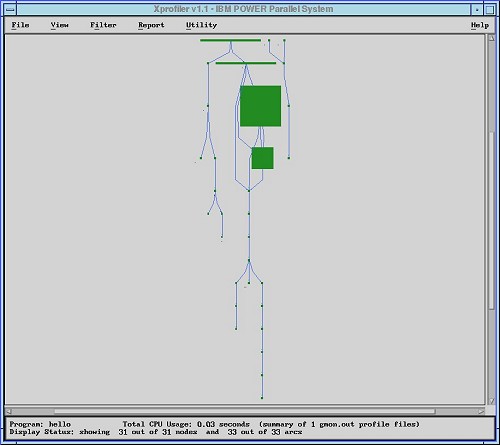
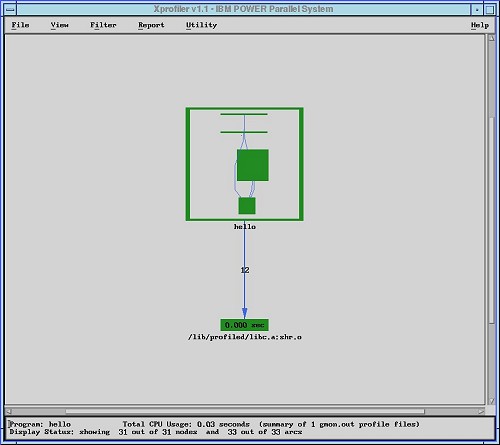
If the functions within your application are unclustered, you can use an option of the Filter menu to cluster them. To do this, select the Filter menu and then the Cluster Functions by Library option. The libraries within your application appear within their respective cluster boxes.
After you cluster the functions in your application you can further reduce the size (also referred to as collapse) of each cluster box by doing the following:
To return the cluster box to its original condition (expand it), do the following:
If the functions within your application are clustered, you can use an option of the Filter menu to uncluster them. To do this, select the Filter menu, and then the Uncluster Functions option. The cluster boxes disappear and the functions boxes of each library expand to fill the Xprofiler window.
If your functions have been clustered, you can remove one or more (but not all) cluster boxes. For example, if you want to uncluster only the functions of your executable file, but keep its shared libraries within their cluster boxes, you would do the following:
If you are interested in one or more specific functions in a complex program, you may need help locating their corresponding function boxes in the function call tree.
If you want to locate a single function, and you know its name, you can use the Locate Function By Name option of the Utility menu. To locate a function by name, do the following:
To display the function call tree in full detail again, go to the View menu and use the Overview option.
You might want to see only the function boxes for the functions that you are concerned with, in addition to other specific functions that are related to it. For example, if you want to see all the functions that directly called the function in which you are interested, it might not be easy to separate these function boxes when you view the entire call tree. You would want to display them, as well as the function of interest, alone.
Each function has its own menu. Through the Function menu, you can choose to see the following for the function you are interested in:
When you use these options, Xprofiler erases the current display and replaces it with only the function boxes for the function of interest and all the functions of the type you specified.
A parent is any function that directly calls the function in which you are interested. To locate the parent function boxes of the function in which you are interested:
A child is any function that is directly called by the function in which you are interested. To locate the child functions boxes for the function in which you are interested:
An ancestor is any function that can call, directly or indirectly, the function in which you are interested. To locate the ancestor functions:
A descendant is any function that can be called, directly or indirectly, by the function in which you are interested. To locate the descendant functions (all the functions that the function of interest can reach, directly or indirectly):
To locate the functions that are on the same cycle as the function in which you are interested:
With Xprofiler, you can get performance data for your application on a number of levels, and in a number of ways. You can easily view data pertaining to a single function, or you can use the reports provided to get information on your application as a whole.
Xprofiler makes it easy to get data on specific items in the function call tree. After you have located the item you are interested in, you can get data a number of ways. If you are having trouble locating a function in the function call tree, see Locating specific objects in the function call tree.
Below each function box in the function call tree is a label that contains basic performance data.
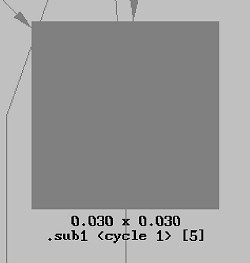
The label contains the name of the function, its associated cycle, if any, and its index. In the preceding figure, the name of the function is sub1. It is associated with cycle 1, and its index is 5. Also, depending on whether the function call tree is viewed in summary mode or average mode, the label will contain different information.
If the function call tree is viewed in summary mode, the label will contain the following information:
If the function call tree is viewed in average mode, the label will contain the following information:
For more information about summary mode and average mode, see Controlling the representation of the function call tree .
Because labels are not always visible in the Xprofiler window when it is fully zoomed out, you may need to zoom in on it in order to see the labels. For information about how to do this, see Information boxes.
Call arc labels appear over each call arc. The label indicates the number of calls that were made between the two functions (from caller to callee). For example:
To see a call arc label, you can zoom in on it. For information about how to do this, see Information boxes.
Cluster box labels indicate the name of the library that is represented by that cluster. If it is a shared library, the label shows its full path name.
For each function box, call arc, and cluster box, a corresponding information box gives you the same basic data that appears on the label. This is useful when the Xprofiler display is fully zoomed out and the labels are not visible. To access the information box, click on the function box, call arc, or cluster box (place the mouse pointer over the edge of the box) with the left mouse button. The information box appears.
For a function, the information box contains the following:
For a call, the information box contains the following:
For a cluster, the information box contains the following:
You can get performance statistics for a single function through the Statistics Report option of the Function menu. This option lets you see data on the CPU usage and call counts of the selected function. If you are using more than one gmon.out file, the Statistics Report option breaks down the statistics for each gmon.out file you use.
When you select the Statistics Report menu option, the Function Level Statistics Report window appears.
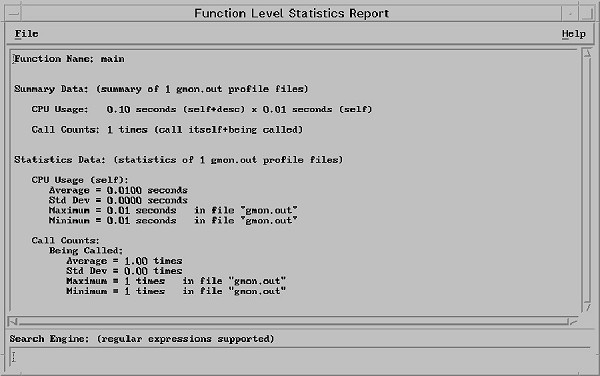
The Function Level Statistics Report window provides the following information:
The name of the function you selected.
The total amount of CPU used by this function. If you used multiple gmon.out files, the value shown here represents their sum.
The CPU Usage field indicates:
The Call Counts field indicates:
The CPU usage and calls made to or by this function, broken down for each gmon.out file.
The CPU Usage field indicates:
The average CPU time used by the data in each gmon.out file.
Standard deviation. A value that represents the difference in CPU usage samplings, per function, from one gmon.out file to another. The smaller the standard deviation, the more balanced the workload.
Of all the gmon.out files, the maximum amount of CPU time used. The corresponding gmon.out file appears to the right.
Of all the gmon.out files, the minimum amount of CPU time used. The corresponding gmon.out file appears to the right.
The Call Counts field indicates:
The average number of calls made to this function or by this function, for each gmon.out file.
Standard deviation. A value that represents the difference in call count sampling, per function, from one gmon.out file to another. A small standard deviation value in this field means that the function was almost always called the same number of times in each gmon.out file.
The maximum number of calls made to this function or by this function in a single gmon.out file. The corresponding gmon.out file appears to the right.
The minimum number of calls made to this function or by this function in a single gmon.out file. The corresponding gmon.out file appears to the right.
Xprofiler provides performance data in textual and tabular format. This data is provided in various tables called reports. Similar to the gprof command, Xprofiler generates the Flat Profile, Call Graph Profile, and Function Index reports, as well as two additional reports.
You can access the Xprofiler reports from the Report menu. The Report menu displays the following:
Each report window includes a File menu. Under the File menu is the Save As option, which lets you save the report to a file. For information about using the Save File Dialog window to save a report to a file, see Saving the Call Graph Profile, Function Index, and Flat Profile reports to a file.
Each of the Xprofiler reports are explained as follows.
When you select the Flat Profile menu option, the Flat Profile window appears. The Flat Profile report shows you the total execution times and call counts for each function (including shared library calls) within your application. The entries for the functions that use the greatest percentage of the total CPU usage appear at the top of the list, while the remaining functions appear in descending order, based on the amount of time used.
Unless you specified the -z flag, the Flat Profile report does not include functions that have no CPU usage and no call counts. The data presented in the Flat Profile window is the same data that is generated with the gprof command.
The Flat Profile report looks similar to the following:
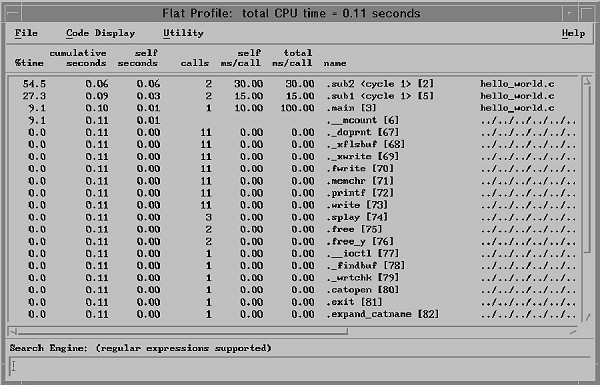
The Flat Profile window contains the following fields:
The percentage of the program's total CPU usage that is consumed by this function.
A running sum of the number of seconds used by this function and those listed above it.
The number of seconds used by this function alone. Xprofiler uses the self seconds values to sort the functions of the Flat Profile report.
The number of times this function was called (if this function is profiled). Otherwise, it is blank.
The average number of milliseconds spent in this function per call (if this function is profiled). Otherwise, it is blank.
The average number of milliseconds spent in this function and its descendants per call (if this function is profiled). Otherwise, it is blank.
The name of the function. The index appears in brackets ([]) to the right of the function name. The index serves as the function's identifier within Xprofiler. It also appears below the corresponding function in the function call tree.
The Call Graph Profile menu option lets you view the functions of your application, sorted by the percentage of total CPU usage that each function, and its descendants, consumed. When you select this option, the Call Graph Profile window appears.
Unless you specified the -z flag, the Call Graph Profile report does not include functions whose CPU usage is 0 (zero) and have no call counts. The data presented in the Call Graph Profile window is the same data that is generated with the gprof command.
The Call Graph Profile report looks similar to the following:
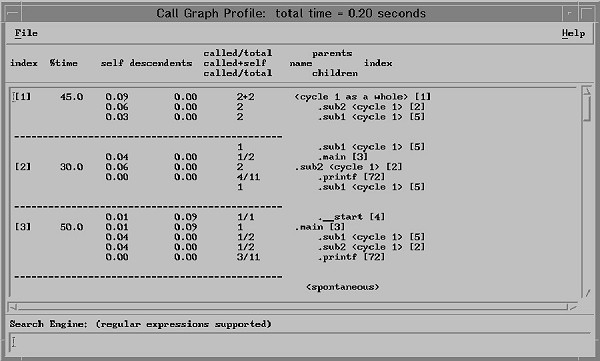
The Call Graph Profile window contains the following fields:
The index of the function in the Call Graph Profile. Each function in the Call Graph Profile has an associated index number which serves as the function's identifier. The same index also appears with each function box label in the function call tree, as well as other Xprofiler reports.
The percentage of the program's total CPU usage that was consumed by this function and its descendants.
The number of seconds this function spends within itself.
The number of seconds spent in the descendants of this function, on behalf of this function.
The heading of this column refers to the different kinds of calls that take place within your program. The values in this field correspond to the functions listed in the name, index, parents, children field to its right. Depending on whether the function is a parent, a child, or the function of interest (the function with the index listed in the index field of this row), this value might represent the number of times that:
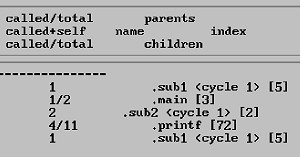
For a parent function, the number of calls made to the function of interest, as well as the total number of calls it made to all functions.
The number of times the function of interest called itself, recursively.
The layout of the heading of this column indicates the information that is provided. To the left is the name of the function, and to its right is the function's index number. Appearing above the function are its parents, and below are its children.
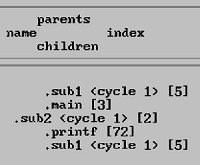
The name of the function, with an indication of its membership in a cycle, if any. The function of interest appears to the left, while its parent and child functions are indented above and below it.
The index of the function in the Call Graph Profile. This number corresponds to the index that appears in the index column of the Call Graph Profile and the on the function box labels in the function call tree.
The parents of the function. A parent is any function that directly calls the function in which you are interested.
If any portion of your application was not compiled with the -pg flag, Xprofiler cannot identify the parents for the functions within those portions. As a result, these parents will be listed as spontaneous in the Call Graph Profile report.
The children of the function. A child is any function that is directly called by the function in which you are interested.
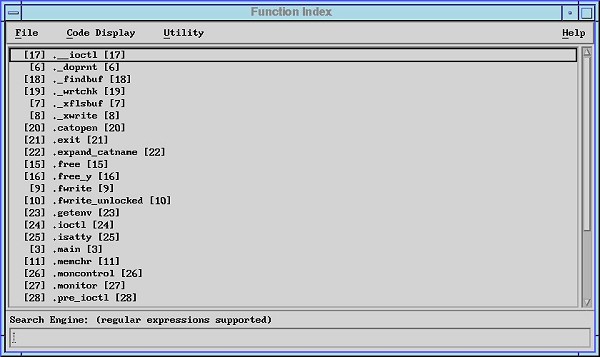
The Function Index menu option lets you view a list of the function names included in the function call tree. When you select this option, the Function Index window appears and displays the function names in alphabetical order. To the left of each function name is its index, enclosed in brackets ([]). The index is the function's identifier, which is assigned by Xprofiler. An index also appears on the label of each corresponding function box in the function call tree, as well as on other reports.
Unless you specified the -z flag, the Function Index report does not include functions that have no CPU usage and no call counts.
Like the Flat Profile menu option, the Function Index menu option includes a Code Display menu, so you can view source code or disassembler code. See Looking at your code for more information.
The Function Index report looks similar to the following:
The Function Call Summary menu option lets you display all the functions in your application that call other functions. They appear as caller-callee pairs (call arcs, in the function call tree), and are sorted by the number of calls in descending order. When you select this option, the Function Call Summary window appears.
The Function Call Summary report looks similar to the following:
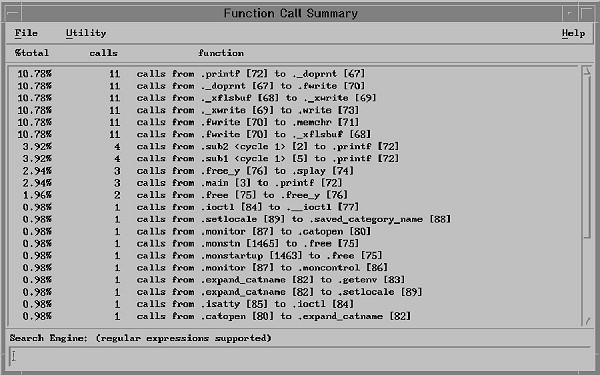
The Function Call Summary window contains the following fields:
The percentage of the total number of calls generated by this caller-callee pair
The number of calls attributed to this caller-callee pair
The name of the caller function and callee function
The Library Statistics menu option lets you display the CPU time consumed and call counts of each library within your application. When you select this option, the Library Statistics window appears.
The Library Statistics report looks similar to the following:
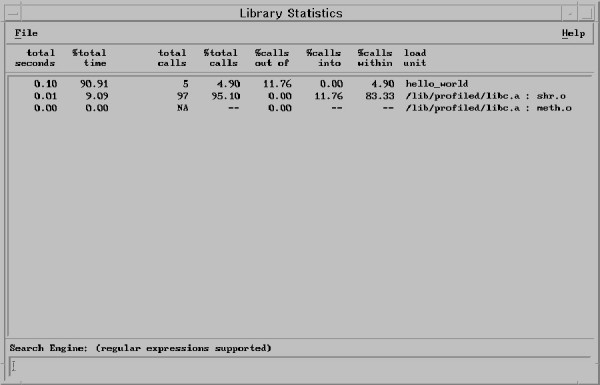
The Library Statistics window contains the following fields:
The total CPU usage of the library, in seconds
The percentage of the total CPU usage that was consumed by this library
The total number of calls that this library generated
The percentage of the total calls that this library generated
The percentage of the total number of calls made from this library to other libraries
The percentage of the total number of calls made from other libraries into this library
The percentage of the total number of calls made between the functions within this library
The library's full path name
Xprofiler lets you save any of the reports you generate with the Report menu to a file. You can do this using the File and Report menus of the Xprofiler GUI.
To save a single report, go to the Report menu on the Xprofiler main window and select the report you want to save. Each report window includes a File menu. Select the File menu and then the Save As option to save the report. A Save dialog window appears, which is named according to the report from which you selected the Save As option. For example, if you chose Save As from the Flat Profile window, the save window is named Save Flat Profile Dialog.
You can save the Call Graph Profile, Function Index, and Flat Profile reports to a single file through the File menu of the Xprofiler main window. The information you generate here is identical to the output of the gprof command. From the File menu, select the Save As option. The Save File Dialog window appears.
To save the reports, do the following:
The File Selection field of the Save File Dialog window follows Motif standards.
If you are profiling a parallel program, you can specify more than one profile data (gmon.out) file when you start Xprofiler. The Save gmon.sum As option of the File menu lets you save a summary of the data in each of these files to a single file.
The Xprofiler Save gmon.sum As option produces the same result as the xprofiler -s command and the gprof -s command. If you run Xprofiler later, you can use the file you create here as input with the -s flag. In this way, you can accumulate summary data over several runs of your application.
To create a summary file, do the following:
The Save Configuration menu option lets you save the names of the functions that are displayed currently to a file. Later, in the same Xprofiler session or in a different session, you can read this configuration file in using the Load Configuration option. For more information, see Loading a configuration file .
To save a configuration file, do the following:
You can use the default file name, enter a file name in the Selection field, or select a file from the file list.
If you selected the Forced File Overwriting option in the Runtime Options Dialog window, the Overwrite File Dialog window does not open and the specified file is overwritten without warning.
The Load Configuration menu option lets you read in a configuration file that you saved. See Saving a configuration file for more information. The Load Configuration option automatically reconstructs the function call tree according to the function names recorded in the configuration file.
To load a configuration file, do the following:
You can also load the file with the -c flag. For more information, see Specifying command line options (from the GUI).
If the a.out name, that is, the program name in the configuration file, is different from the a.out name in the current display, a confirmation dialog asks you whether you still want to load the file.
Xprofiler provides several ways for you to view your code. You can view the source code or the disassembler code for your application, for each function. This also applies to any included function code that your application might use.
To view source or included function code, use the Source Code window. To view disassembler code, use the Disassembler Code window. You can access these windows through the Report menu of the Xprofiler GUI or the Function menu of the function you are interested in.
Both the Function menu and Report menu allow you to access the Source Code window, from which you can view your code.
To access the Source Code window through the Function menu:
To access the Source Code window through the Report menu:
The Source Code window shows you the source code file for the function you specified from the Flat Profile window or the Function menu. The Source Code window looks similar to the following:
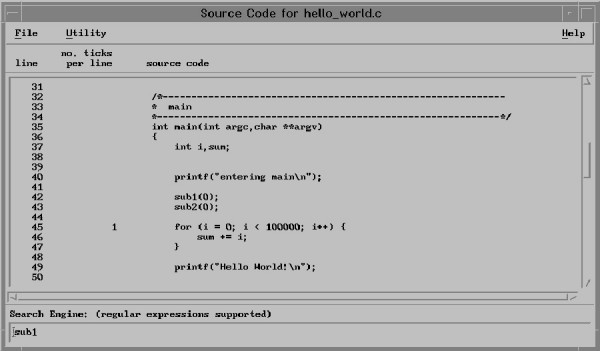
The Source Code window contains information in the following fields:
The source code line number.
Each tick represents .01 seconds of CPU time used. The value in this field represents the number of ticks used by the corresponding line of code. For example, if the number 3 appeared in this field, for a source statement, this source statement would have used .03 seconds of CPU time. The CPU usage data only appears in this field if you used the -g flag when you compiled your application. Otherwise, this field is blank.
The application's source code.
The Source Code window contains the following menus:
The Save As option lets you save the annotated source code to a file. When you select this option, the Save File Dialog window appears. For more information about using the Save File Dialog window, see Saving the Call Graph Profile, Function Index, and Flat Profile reports to a file.
To close the Source Code window, select Close.
This menu contains the Show Included Functions option.
For C++ users, the Show Included Functions option lets you view the source code of included function files that are included by the application's source code.
If a selected function does not have an included function file associated with it or does not have the function file information available because the -g flag was not used for compiling, the Utility menu will be greyed out. The availability of the Utility menu indicates whether there is any included function-file information associated with the selected function.
When you select the Show Included Functions option, the Included Functions Dialog window appears, which lists all of the included function files. Specify a file by either clicking on one of the entries in the list with the left mouse button, or by typing the file name in the Selection field. Then click OK or Apply. After you select a file from the Included Functions Dialog window, the Included Function File window appears, displaying the source code for the file that you specified.
Both the Function menu and Report menu allow you to access the Disassembler Code window, from which you can view your code.
To access the Disassembler Code window through the Function menu, do the following:
To access the Disassembler Code window through the Report menu, do the following:
The Disassembler Code window shows you only the disassembler code for the function you specified from the Flat Profile window. The Disassembler Code window looks similar to the following:
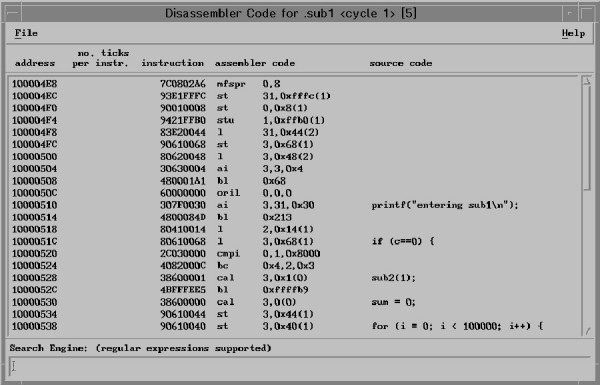
The Disassembler Code window contains information in the following fields:
The address of each instruction in the function you selected (from either the Flat Profile window or the function call tree).
Each tick represents .01 seconds of CPU time used. The value in this field represents the number of ticks used by the corresponding instruction. For instance, if the number 3 appeared in this field, this instruction would have used .03 seconds of CPU time.
The execution instruction.
The execution instruction's corresponding assembler code.
The line in your application's source code that corresponds to the execution instruction and assembler code. In order for information to appear in this field, you must have compiled your application with the -g flag.
The Search Engine field at the bottom of the Disassembler Code window lets you search for a specific string in your disassembler code.
The Disassembler Code window contains one menu:
Select Save As to save the annotated disassembler code to a file. When you select this option, the Save File Dialog window appears. For information on using the Save File Dialog window, see Saving the Call Graph Profile, Function Index, and Flat Profile reports to a file.
To close the Disassembler Code window, select Close.
The File menu of the Xprofiler GUI includes an option called Screen Dump that lets you capture an image of the Xprofiler main window. This option is useful if you want to save a copy of the graphical display to refer to later. You can either save the image as a file in PostScript format, or send it directly to a printer.
To capture a window image, do the following:
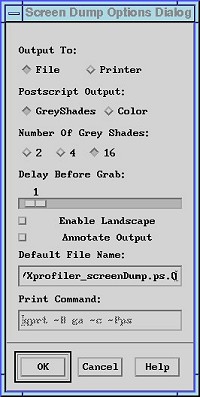
This option lets you specify whether you want to save the captured image as a PostScript file or send it directly to a printer.
If you would like to save the image to a file, select the File button. This file, by default, is named Xprofiler.screenDump.ps.0, and is displayed in the Default File Name field of this dialog window. When you select the File button, the text in the Print Command field greys out.
To send the image directly to a printer, select the Printer button. The image is sent to the printer you specify in the Print Command field of this dialog window. When you specify the Print option, a file of the image is not saved. Also, selecting this option causes the text in the Default File Name field is made unavailable.
This option lets you specify whether you want to capture the image in shades of grey or in color.
If you want to capture the image in shades of grey, select the GreyShades button. You must also select the number of shades you want the image to include with the Number of Grey Shades option, as discussed below.
If you want to capture the image in color, select the Color button.
This option lets you specify the number of grey shades that the captured image will include. Select either the 2, 4, or 16 buttons, depending on the number of shades you want to use. Typically, the more shades you use, the longer it will take to print the image.
This option lets you specify how much of a delay will occur between activating the capturing mechanism and when the image is actually captured. By default, the delay is set to one second, but you may need time to arrange the window the way you want it. Setting the delay to a longer interval gives you some extra time to do this. You set the delay with the slider bar of this field. The number above the slider indicates the time interval in seconds. You can set the delay to a maximum of thirty seconds.
This option lets you specify that you want the output to be in landscape format (the default is portrait). To select landscape format, select the Enable Landscape button.
This option lets you specify that you would like information about how the file was created to be included in the PostScript image file. By default, this information is not included. To include this information, select the Annotate Output button.
If you chose to put your output in a file, this field lets you specify the file name. The default file name is Xprofiler.screenDump.ps.0. If you want to change to a different file name, type it over the one that appears in this field.
If you specify the output file name with an integer suffix (that is, the file name ends with xxx.nn, where nn is a non-negative integer), the suffix automatically increases by one every time a new output file is written in the same Xprofiler session.
If you chose to send the captured image directly to a printer, this field lets you specify the print command. The default print command is qprt -B ga -c -Pps. If you want to use a different command, type the new command over the one that appears in this field.
After you have set your screen dump options, you need to select the window, or portion of a window, you want to capture. From the Screen Dump menu, select the Select Target Window option. A cursor that looks like a person's hand appears after the number of seconds you specified. To cancel the capture, click the right mouse button. The hand-shaped cursor will revert to normal and the operation will be terminated.
To capture the entire Xprofiler window, place the cursor in the window and then click the left mouse button.
To capture a portion of the Xprofiler window, do the following:
If you chose to save the image as a file, the file is stored in the directory that you specified. If you chose to print the image, the image is sent to the printer you specified.