When we attempt to compare the performance of a given piece of software in different environments, we are subject to a number of possible errors, some technical, some conceptual. This section contains mostly cautionary information. Other sections of this book discuss the various ways in which elapsed and process-specific times can be measured.
When we measure the elapsed (wall-clock) time required to process a system call, we get a number that consists of the following:
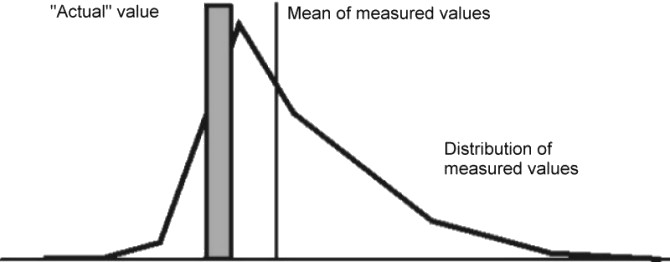
To avoid reporting an inaccurate number, we normally measure the workload a number of times. Because all of the extraneous factors add to the actual processing time, the typical set of measurements has a curve of the form shown in the following illustration.
Figure 1-3. Curve for Typical Set of Measurement
|
The extreme low end may represent a low-probability optimum caching situation or may be a rounding effect.
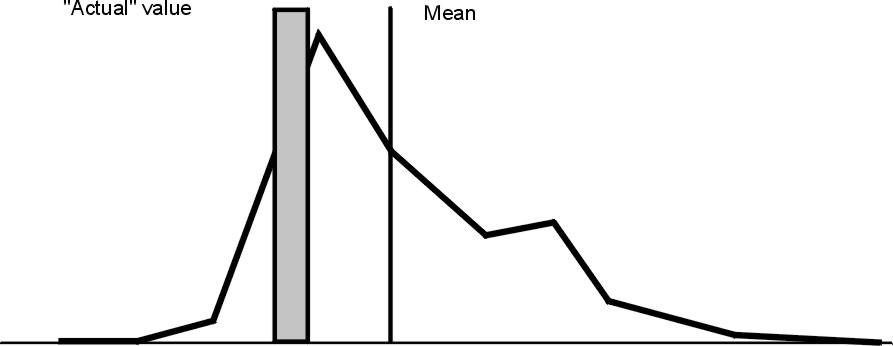
A regularly recurring extraneous event might give the curve a bimodal form (two maxima), as shown in the following illustration.
 |
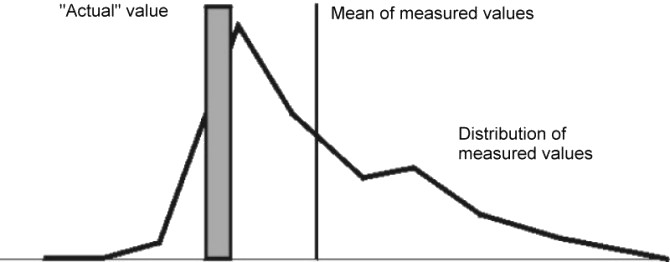
One or two time-consuming interrupts might skew the curve even further, as shown in the following illustration:
 |
The distribution of the measurements about the actual value is not random, and the classic tests of inferential statistics can be applied only with great caution. Also, depending on the purpose of the measurement, it may be that neither the mean nor the actual value is an appropriate characterization of performance.