This chapter provides information about the azizo program.
This section introduces you to azizo by explaining how the program initially processes a recording file. It then describes the two window types used by azizo: the main window and the main graph windows. Finally, it describes how to invoke azizo from the command line.
The azizo program analyzes one recording file at a time. If multiple recordings must be analyzed together, the support program ptxmerge can be used to merge multiple recording files into one for simultaneous analysis of statistics from multiple sources.
Recording files may contain console definitions but they are of no use in the analysis performed by azizo and are ignored, except when a filtered recording is produced. All other record types in recording files are used to build the data tables used in the analysis.
Whenever azizo reads a recording file, it first finds all the statistics defined in the file. For each statistic, it builds a table with a number of elements corresponding to the width of the graph area. Each element has the following fields:
The same statistic can appear in more than one of the sets of statistics (statsets) in the recording file and it can appear more than once in any set. All such statistics are collected into one table by azizo.
After building the statistics tables, azizo determines the time period covered by the recording. From this, it calculates how time stamps correspond to elements in the statistics tables. Next, all value records are read and their observations are routed to the table elements that correspond to the value record's time stamp.
When extracting statistic values from the recording file, azizo uses one of the two observation fields in the value record depending on the type of the statistic. Statistics can be of type SiCounter or of type SiQuantity:
When the entire recording file has been read, azizo calculates statistical data for each statistic. This includes:
In the next step, azizo creates small graphs for each of the statistics it has detected. Such graphs are called metrics graphs and are displayed in the azizo main window in a scrollable list.
The maximum number of statisticsazizo can process is 256. If more than 256 statistics exist in a recording file, metrics graphs are created for only the first 256. When more than 256 statistics are encountered,azizo informs the user through a message window. Even though only 256 metrics graphs are created, if you use the Rescan option when zooming in on a main graph, all the statistics in the recording file are included in the scan because the scan is done on the actual file rather than the set of metrics graphs. Up to 256 metrics are included in the zoomed-in main graph but some of those may not have a corresponding metrics graph. Zooming-in on main graphs is described in "Zooming-in on Main Graphs" .
As the final step, azizo creates a main graph in a separate window. This graph contains all or a selection of the statistics in the recording file in a single graph, depending on the number of statistics at hand and the characteristics of the observations for each.
The azizo main window is divided horizontally into three sections:
The main window has full window decorations but the Close option of the window manager menu has been disabled to prevent accidental exit of azizo.
[Figure] Main Window of azizoAt the top of the main window is the icon section. The icon section of the window always has a fixed height. It is subdivided into three sections:
The metrics selection window occupies the middle part of the main window. It is the only section of the main window that changes height when the main window is resized. At its top is the title part, which identifies the recording file and shows a time scale and the time stamps of the earliest and the latest observation in that file. Following the title part comes a scrollable list of the metrics graphs that were created from the statistics contained in the recording file.
The title part is considered an object as is each of the metrics graphs. Actions can be performed on individual metrics by dragging their metrics graphs to an action icon. Actions can be performed on all of the metrics in the metrics selection window by dragging the title part object to an action icon.
"Using the azizo Metrics Selection Window" describes how to work with the metrics selection window.
The message window is a scrollable text window at the bottom of the main window. It is used to display messages from azizo to the end user. Approximately 80 message lines are retained for the user to scroll back in.
Error messages sent to the message window are also logged to the azizo log file in $HOME/azizo.log . This log file is overwritten each time azizo starts and is not closed until azizo terminates. Therefore, its contents are not dependable until you exit azizo.
Main graphs are the principal viewing windows of azizo. When azizo reads a recording file, it always displays a top level main graph that covers the entire time interval of the recording file. You can create additional main graphs by zooming in on the top level graph or any zoomed-in main graph.
Main graphs contain two sections. To the left is a list of metrics that are included in the graph. The metric names are displayed using the same color as is used to draw the data. If the list of metrics is longer than the window can display, a scroll bar allows you to scroll the list of metrics.
To the right is the actual graphical display of the metrics data for the time period covered by the graph. Graphs are drawn from tables with elements corresponding to time intervals of equal length. Each element can house one, multiple, or no raw observations from the recording file. The drawing style is line graph, meaning that the observation points for a metric are connected by a line drawn in the assigned color. Where the recording file contains stop records to signify that recording for one or more sets of statistics was stopped, the line graphs are broken so that it is immediately apparent that some elements do not contain data.
Lines for a metric can be drawn from the maximum value encountered in the time intervals, from the minimum value, from the average value, or from both the minimum and the maximum values. Below the actual graph area is a scale that divides the displayed graph into seconds, minutes, hours, days, or weeks, depending on the time period covered by the graph. The scale carries time stamps that are inserted as close as space permits. The start time and the stop time limiting the interval covered by the graph are displayed at the ends of the scale.
If you resize the window containing a main graph, the graph adjusts to the changed height. It does not adjust to a changed window width, except when the window is made so narrow that the whole graph can not be displayed. In that case, a scroll bar appears so you can scroll the main graph horizontally.
When the top level main graph is created, metrics are ordered after a factor calculated as the maximum value encountered in the recording divided by the anticipated maximum value for the metric as defined in the recording file. Included in the top level main graph is up to a user defined number of metrics. This number is defined by the X resource MainGraphCount. It defaults to 16. The metrics to be included are selected from the top of the ordered list.
Colors are allocated from the colors defined by the X resources ValueColor1 through ValueColor24. If more than 24 metrics are displayed, the color table is reused.
The width of the top level graph is determined by the X resource MetricWidth. It defaults to 600 pixels. This effectively sets the width of the top level main graph to the same as that of the metrics graphs in the metrics selection window and allows for easy correlation between the two windows. The height of the top level graph is set according to the X resource MainGraphHeight, which defaults to 300.
A top level main graph can not be deleted. However, you can remove all the metrics from it in one operation.
A zoomed-in main graph is always derived from some other main graph. Its ancestor may be the top level main graph or a zoomed-in main graph. The zoom-in operation is described in "Zooming-in on Main Graphs" .
All zoomed-in main graphs are created with a width determined by the X resource MainGraphWidth and a height set by the X resource MainGraphHeight. These two default to 600 and 300 pixels, respectively. Zoomed-in main graphs can be deleted by dragging them to the Pit Icon. If a main graph has zoomed-in descendants, all those are deleted when the main graph itself is dragged to the Pit icon.
The azizo program is started with the following command line:
The command line argument is optional and has the following meaning:
Beginning with Version 2.2, this argument also brings up the recording's existing annotation file, or creates a new one, so that the user can take notes about the recording.
This section explains the mechanics of the azizo user interface. It is significantly different from the user interface of the xmperf program because it uses a drag-and-drop technique rather than a menu interface.
The drag-and-drop interface is based upon a notion of objects, which are "things" you can manipulate, and actions, which represent the ways you can manipulate the objects. In most cases, you specify what you want by dragging an object to an action. If the action is valid for the object, the action is performed on the object, sometimes after further interaction with you.
Most actions are represented by icons but main graph windows also represent actions for certain types of objects. For example, you can add a metric to a main graph by dragging a metrics graph object to the main graph.
A few operations are not implemented as drag-and-drop operations. they are explained in the sections, "Non-drag Operations" and "Zooming-in on Main Graphs" .
Icons are the little square buttons displayed in the "Actions" and "Files" sections of the azizo main window. The icons in the "Files" section act as activators for windows that you use to access recording files. You click on one of these icons to activate the corresponding window.
Icons in the "Actions" window are mostly "receivers" of objects on which you wish to perform the associated action. For example, if you want to delete an object, you drag it to the Pit Icon and drop it there. When you drag an object to an icon, you can immediately see if the action represented by the icon can be performed on the object. If it can, the icon changes shape to indicate that it accepts objects of the type you drag. If the icon does not accept objects of this type, the icon remains unchanged and an attempt to drop the object causes the dragged object representation to snap back to the object.
All icons, with the exception of the Help Icon itself, can be dragged to and dropped onto the Help Icon. This opens a help window that explains the function of the dragged icon.
Normally, icons are colorful little things that are generated from icon description files in directory /usr/lib/X11/app-defaults/perfmgr/icons on your system. If one or more icon description files have been deleted, or if resources (such as colors) are not available on your system, the icons appear as text buttons. Whenever this occurs, the azizo log file in your home directory ($HOME/azizo.log ) explains the reason for not displaying color icons.
The text shows one of the following error codes:
1 Error matching color
-1 Unable to open icon description file
-2 Icon description file has invalid data
-3 X Server is out of memory
-4 Unable to allocate color
Note: The log file contents are not dependable until you exit azizo.
Icon description files must be in the format defined by XPM2 (X Pixmap Format 2).
Dragging is performed with the pointing device (mouse). To drag an object, move the pointer over the object you want to drag, then press mouse button 2. Keep the mouse button pressed and move the pointer to where you want to drop the object.
As you move the pointer, the shape of the pointer changes to a drag icon that identifies the object you are dragging. At the top left of the drag icon is a small arrow. The tip of the arrow is considered the active point of the drag icon.
If the action you drag the object to can be performed on the object, the action indicates this by changing shape. Where the action is represented by an icon, the icon itself changes to a slightly larger icon. If the action is represented by a window, the window is surrounded by a highlighting frame. This allows you to validate a drag-and-drop operation before you complete it.
To complete the drag-and-drop operation, release mouse button 2 while the active point of the drag icon is within the outline of the action. If the action can be performed on the object, the drag icon appears to be absorbed by the action icon or window. If the action can't be performed on the object, the drag icon appears to "snap back" into the object as if connected to it with a rubber band.
A special action is represented by the help icon in the action icon section of the main window. You can drag other action icons and objects to this icon to display a help screen that explains the action or object. For each action, the help screen explains which objects it can be applied to; for each object, the help screen explains which actions can be performed on it.
The azizo program defines the following objects:
Each of the defined objects is associated with a different drag icon. If your current setup prevents the drag icon from being created as a color drag icon, a simpler icon that shows the name of the drag icon is used.
Most of the actions you can perform on azizo objects are represented by icons. The only exception is that main graphs can act as actions for certain objects. The full list of actions is the following:
Non-drag operations are defined for special cases. Non-drag operations on main graphs are described in "Zooming-in on Main Graphs" ; others in the sections below.
When you want to select a recording file to analyze, this can be done on the command line when you start azizo or it can be done by clicking on the Local Files Icon in the Files icon section of the main window. When you click on the icon, the Select Recording File selection box pops open.
It is a standard file selection box, which allows you to change the "filter" to show any selection of files that match the filter. The default filter is:
$HOME/XmRec/R.*
All xmperf and 3dmon recordings in the designated recording directory for your user ID match this filter. To see all xmservd recordings on your machine, change the filter to the following and click on the Filter button:
/etc/perf/azizo.*
Once the file you wish to analyze is shown in the Files section of the selection box, double-click on the file name or click on the file name to select it and then on the OK button. This causes the selected file to become the current recording file. All previous main graphs are removed and so are all metrics graphs in the metrics selection window; azizo then resets itself and reads the new file as described in "Initial Processing of Recording Files" . When a top level main graph appears, you can start working with the new file.
To exit the azizo program, you must click on the Exit Icon with mouse button 1. This pops open the Exit azizo dialog box which asks you to confirm that you want to exit the program by clicking on OK. To resume using the program, click on Cancel.
In azizo, help can be invoked in three ways:
The help function depends on the presence of a help file for azizo with a format as described in "Simple Help File Formats" . The file is looked for under the name azizo.hlp in the user's home directory. If the file is not found there, it is searched for as described in "Overview of File Placement" .
The help file contains help texts that are identified by a string of characters. Every object and every action defined by azizo and every dialog box has an identifier (a string of characters) associated with it. Whenever you select help by dragging an object or action to the Help Icon or from a dialog window, the identifier of the object, action, or dialog box is used to locate the associated help text. In the resulting help window, the window frame shows the identifier used to locate the help text.
You can browse through the help text by using the scroll bar to the right in the help window. The help window shows up to 25 lines at a time.
From any help window, you can get to an index of help topics by using the pulldown Help menu and then select Help Index. The index is a list of all help identifiers available. When you click on a line, a help window is created with the associated help text. From the menu bar's Help item, you can select the menu item Help on Help for detailed instructions on how to use help.
When using Version 2.2 or later, to create or modify an annotation to the current recording file, drag the graph area of the main graph to the Annotate Icon and drop it there. An editor window will appear. From the editor window you can modify any existing annotation text or create a new annotation file if none existed before.
When you have made the changes you want, exit the editor window with the file or save option of the editor in use. If you exit the editor with the quit without saving option of the editor in use, any existing annotation file is left unchanged and no new annotation file is created if none existed before.
The metrics selection window is created as an OSF/Motif widget of type XmForm, which contains an XmLabel widget to display the title part of the window and an XmScrolledWindow widget used to display a scrollable list of metrics graphs. If all the contained metrics graphs can be displayed in the window, the vertical scroll bar is missing; if the full width of the metrics graphs can be shown in the window, no horizontal scroll bar is present. When the vertical scroll bar is active, it can be used to scroll through the metrics graphs. When the horizontal scroll bar is visible, it can be used to scroll the entire set of metrics graphs left and right.
The title part of the window has a left part that gives information about the way metrics graphs are displayed and a right part, which shows the time scale and other information as it applies to all the metrics graphs.
The left side of the title part shows the graph style used to draw the metrics graphs. If the same style is not used for all metrics graphs, the graph style is shown as "Mixed." Below the graph style is a line showing the meaning of the tick marks of the scale in the right section of the title part. It may show that each tick mark on the scale corresponds to a minute, an hour, a day, or a week, depending on the time period covered by the graph.
The right side of the title part contains a time scale that applies to all metrics graphs. It is aligned so each tick mark on the scale corresponds to full minutes, hours, days, or weeks. Above and at each end of the scale is a full time stamp that shows the times of the earliest and the latest observation as encountered in the recording file. Above and over the center of the scale is shown the file name of the current recording file. If the title part is too narrow to allow time stamps and file name to be displayed side by side, the file name is overlapping the time stamps.
The end time is determined by the highest time stamp found among the last several value records of the file. If the current recording file is a file produced by concatenating multiple recording files into one without using the ptxmerge program, then you may see interesting, though not necessarily useful, side effects, especially when the end time is lower than the start time. It is not recommended to use azizo to analyze such files without first using the ptxmerge program to rearrange records in the files or using the ptxsplit program to split the file into its individual recordings.
Each metrics graph has a left side used to display the full path name of the metric it represents and a right side that displays a graph representing the observations for the metric. The width of the left side is set by the X resource MetricLegendWidth. When the graph is initially created, the style of the graph is determined by the horizontal scale of the graph and the X resources MetricLinePlot and MetricLineDouble. The colors used to draw the graph are determined by the X resources OnlyMetricColorIndex, FirstMetricColorIndex, and SecondMetricColorIndex. The width of the individual metrics graphs is set through the X Resource MetricWidth.
By default, neither the MetricLinePlot nor the MetricLineDouble resource is set true. The style then defaults to "Bar, Max-to-Min." If each pixel on the horizontal scale corresponds less than one second, the "Bar, Max-to-Min" style is not meaningful and the default style is changed to "Line, Max & Min."
The style of individual or all metrics graphs can be changed as explained in "Changing the Style of Metrics" .
The following X resources control the initial appearance of metrics selection windows:
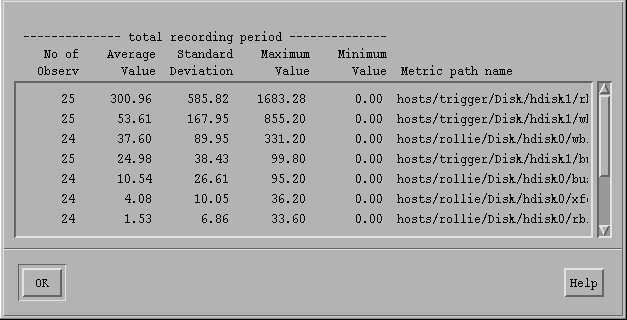
Each of the metrics graphs represents a single statistic as recorded in the current file. You can see a tabular view of the statistical data for one or all metrics in the metrics selection window by dragging a single metrics graph or the title part of the metrics selection window to the Info Icon. The tabular view is shown in an information window. The color of information windows can be set through the X resource InfoWindow.
[Figure] Information Window for Metrics Selection WindowIf the object you drag to the Info Icon is a single metrics graph, a small window displays the statistical data as calculated for the corresponding metric. This window can not be used as an object. All you can do is look at it and then click on OK to make it disappear.
If the object you drag is the title part of the metrics selection window, a larger information window appears. This window contains a line for each of the metrics graphs in the metrics selection window. An example of such an information window is shown here
The tabular view can be printed by dragging the information window to the Print Icon. To drag the window, place the mouse pointer anywhere within the data part of the window and start the drag operation from there. To close the window, click on OK.
The metrics graphs can be printed individually or they can be printed as a selection of metrics graphs. To print an individual metrics graph, drag the metrics graph to the Print Icon. To print multiple metrics graphs, position the vertical scroll bar of the metrics selection window so the metrics graphs you want to print are visible in the metrics selection window and then drag the title part of the metrics selection window to the Print Icon. The printed image contains everything that is visible in the metrics selection window, including the title part. Tabular views of all metrics in the metrics selection window can be printed by dragging the data part of the information window to the Print Icon.
After you drop a graph object on the Print Icon to print one or more graphs, the Print Box dialog box appears. From this dialog box, you can specify the destination as a printer or a named file. You can also specify other options to use for printing. This is explained in "The Print Box" .
For printing of information windows, the Report Box pops open. This dialog box allows you to specify the destination of the print output as a printer or a named file. You can also specify other options to use for printing. It is explained in "The Report Box" .
The style of one or all metrics graphs can be changed by dragging the metrics graph or the title part of the metrics selection window to the View Icon. This causes the Changing View Options dialog box to pop open. From this dialog box you can change the graph style of the metrics graph or all the metrics graphs into either of:
These styles and the dialog box are explained in "Changing View Options Dialog Box" .
If a metrics graph represents a statistic you don't need in the analysis, you can remove it from the metrics selection window. You do so by dragging the metrics graph to the Pit Icon. When the metrics graph is removed, the corresponding metric is also removed from all the main graphs it is part of.
Once a metric is removed from the metrics selection window, it can not be added back to the metrics selection window except by rereading the recording file. However, if you use the Rescan option when zooming in on a main graph, the deleted metric is included in the scan, because the scan is done on the actual file rather than the metrics selection window.
Main graph windows are created as OSF/Motif top level windows of the ApplicationShell widget class. They contain two subwindows, both of which are scrollable. To the left is the metrics label part, to the right is the actual graph part of the window. The parts have horizontal scroll bars if the current width of the main graph window doesn't allow all of the information in the windows to be displayed in its entirety.
The metrics label part have a vertical scroll bar if the height of the main graph window doesn't allow all metric labels to be displayed at the same time. The graph part never has a vertical scroll bar. It resizes the height of the graph area to fit the size of the enclosing main graph window. At times, resizing of the graph area may not occur after the main graph window is made smaller. Requesting a refresh from the window manager forces the resizing.
The window frames of main graph windows have full window manager decorations. However, the Close option of the Window Manager menu is disabled to prevent accidental closure of a main graph window.
The title bar of a main graph window indicates the degree of zoom-in applied to create the window. The top level main graph always has the text 100% in the title bar. All other main graphs have a title bar that shows the time span they cover in percent of the time span of the top level main graph. Such percentages are shown with two decimal places so that a graph derived from the top level graph but covering the same time span, has a title bar that says 100.00%.
Since it is possible to have multiple derived main graphs that cover the same percentage of the total time or even the exact same interval, multiple main graph windows can have identical title bars.
Metrics represent statistics and are identified by the full path name of the statistic. The metrics label part of a main graph window contains a list of path names to illustrate which metrics are included in the main graph. Each entry in the list is called a metric label.
Each of the metric labels consists of two lines. The first line shows the full path name of the metric. The second line first lists the scale used when drawing the line graph of the metric. The scale is given as a from-to value. Note that the scale for a statistic of type SiCounter represents a rate per second.
The metric label part of the main graph window has a fixed width determined by the longest path name displayed and the font in use. Occasionally, the metric label part of the main graph window is too narrow to show the entire path name. When this happens, a horizontal scroll bar allows you to scroll horizontally in the entire list of metric labels.
Following the scale and on the same line, is the current drawing style for the metric. The style is enclosed in square brackets and is one of the following words or abbreviations:
The meaning of these and how to change the style of a metric is explained in the sections "Changing the Appearance of Main Graphs" and "Changing View Options Dialog Box" .
Colors are assigned to metrics in the order they appear in the metrics label part. The first metric gets the color defined by the X resource ValueColor1, the next gets the color defined by ValueColor2. This continues until there are no more metric labels to add or until the 24th color is assigned. If more labels need to be assigned a color, assignment starts over again from ValueColor1.
The graph part of the main graph window is used to draw a line graph for each of the metric labels in the left part of the window. The lines are drawn in the same colors as are used to display the metric labels.
The drawing area extends from the top inner frame of the enclosing window and down to the scale line at the bottom of the window. The distance between the scale line and the bottom inner frame of the window is twice the height of the active font.
The graph has four horizontal lines drawn to indicate the 25%, 50%, 75%, and 100% vertical scale lines. Only the 50% and the 100% lines are drawn if the height of the graph area is too small to make four vertical scale lines feasible. The 100% vertical scale line is positioned so it is possible to draw values up to approximately 105% within the drawing area. As an illustration of the use of vertical scale lines, assume a metric label shows a scale of 0-2000. The 25% vertical scale line for this metric would correspond to an observation value of 500.
The line graphs are drawn according to the style selected for the metrics as shown in the metric labels. Initially, all metrics have the same style, as determined by the X resource MainPlotStyle. Styles for individual or all metrics can be changed later as described in "Changing the Appearance of Main Graphs" and "Changing View Options Dialog Box" .
The scale line at the bottom of the graph area has tick marks that divide the interval covered by the main graph into units of seconds, minutes, hours, days, or weeks. Some of the tick marks are slightly longer than others and correspond to time stamps placed directly below.
At the bottom left of the graph area is a time stamp that gives the time of the earliest observation included in the graph. At the bottom right of the graph area is a time stamp that gives the time of the latest observation included in the graph.
The following X resources control the initial appearance of Main Graphs:
One of the vital functions of azizo is the ability to zoom-in on subsections of a main graph. The zoom-in is achieved by drawing an outline in the main graph area and then selecting the type of zoom-in from a dialog window. The outline is shaped as a rectangle and defines an area of interest.
You draw the outline by moving the mouse pointer to the place where you want one of the corners of the rectangle to be. Then press mouse button 1 and keep it down while moving the mouse pointer. This draws a rubberband outline of the rectangle. When the outline has the size you want, release the mouse button. The left and right sides of the rectangle define the area of interest in time. The top and bottom sides of the rectangle declare the observation value area of interest.
[Figure] Zoom-in Dialog Box, azizoWhen the outline is drawn, the Zoom-in dialog box appears. From this dialog box you must click on Rescan or Keep Metrics to go through with the zoom-in operation.
When you click on Rescan, the left and right sides of the rectangle are used to exclude all observations in the recording file that fall outside the time period limited by the two sides. Then all remaining observations are analyzed to see if any one of them has at least one observation that falls within the top and bottom lines of the rectangle. When determining if an observation falls within the area, the plot point is calculated from the assumption that the 100% line in the graph area corresponds to the anticipated maximum value as retrieved from the recording file. All metrics that have at least one observation within the "area of interest" are included in the zoomed-in graph.
Note that a metric can have an observation value that falls within the outline without the source graph showing this. It often is the case when each interval contains multiple observation values because the main graph shows only the maximum, minimum, or average values for each interval.
When you click on Keep Metrics the zoomed-in graph is created with the same metrics as the source main graph. The left and right sides of the rectangle are used to exclude all metric observations in the recording file that fall outside the time period limited by the two sides. This selection corresponds to a zoom-in in time.
[Figure] Zoom-in Main Graph, azizoFor recording files that contain many statistics, it can be difficult to select exactly the metrics of interest through the Rescan option of the zoom-in operation. This can be remedied by adding and deleting single metrics from a main graph. This section describes how to add metrics to a main graph.
The operation is as simple as dragging a metrics graph from the metrics selection window to the graph area of the main graph window and dropping it there. If the metric is already part of the main graph, nothing happens. Otherwise, the metric is added to the main graph and both parts of the main graph window are updated to reflect this. The added metric is given the first free color from the table defined by the X resources ValueColor1 through ValueColor24.
A metric can be removed from a main graph as easily as it can be added to it. To remove a metric from a main graph, drag the corresponding metric label from the metrics label area to the Pit Icon. This removes the metric from the main graph and updates both parts of the main graph window to reflect the change.
When a main graph is no longer needed, it can be deleted by dragging it to the Pit Icon and dropping it there. This causes the main graph and all its descendants (all main graphs created by zooming-in on the dragged graph) to be deleted. If the dragged graph is the top level main graph, this graph itself is not deleted but all its metrics are removed from it. To make the empty main graph show metrics again, you must drag individual metrics graphs to the main graph from the metrics selection window.
Each of the metrics in a main graph represents a single metric as recorded in the current file. You can see a tabular view of the statistical data as calculated for the metrics that are included in the main graph by dragging the graph area of the main graph to the Info Icon.
This creates an information window that contains a line for each of the metrics in the main graph. If the graph is the top level main graph, the information window has only one part, showing the statistical data as calculated for the entire time period covered by the recording file. If the graph is a zoomed-in main graph, the window has one part that displays the statistical data for the full time period and another showing them for the zoomed-in time period.
If a metric is part of a main graph but is no longer in the metrics selection window, statistical information for the metric in the full time period of the recording is not available and can not be shown in the window. If the information window is printed, such metrics do not appear in the part of the report that covers the entire recording time period.
The tabular view can be printed by dragging the information window to the Print Icon. To drag the window, place the mouse pointer anywhere within the data part of the window and start the drag operation from there. To close the Information window, click on OK.
You can also drag a metric label to the Info Icon. This produces a small window that displays the statistical data as calculated for the corresponding metric. This window can not be used as an object. All you can do is look at it and then click on OK to make it disappear.
[Figure] Information Window for a Zoomed-in Main Graph, azizoIf you drag the graph area of a main graph to the Print Icon and drop it there, you can print the graphical representation of the entire main graph window. This is done from the "Print Box" dialog that appears after you drop the main graph. From the Print Box you must select the options to use when printing the graph and enter the description you want printed with the graph. You can select to print directly to one of the printers known by your system, or you can send the print image to a file. Print images are in PostScript format. The Print Box is described in "The Print Box" .
The appearance of a main graph can be altered by changing the height of the main graph with the window manager. This causes the graph to be redrawn so the graph area fills the entire height of the enclosing window. Another way to change the appearance is to apply a previously saved configuration view to it. This is explained in "Using the azizo Configuration File" .
Finally, the appearance can be changed through either or both of the two drag-and-drop operations described below. You invoke these operations for a single metric in a main graph by dragging its metric label to the View Icon or the Scale Icon. You invoke them for all metrics in the main graph by dragging the graph area of a main graph to the View Icon or the Scale Icon.
Dragging a main graph to the View Icon signals to azizo that you want to change the view (drawing style) for all of the metrics that are currently included in the main graph. When you drop the main graph on the View Icon, azizo displays a dialog box titled Changing View Options. This dialog box allows you to change the way all metrics are plotted in the main graph. The view style you select becomes the default view style for the main graph.
Dragging a metric label of a main graph to the View Icon tells azizo that you want to change the view (drawing style) of the corresponding metric in the main graph. The Changing View Options dialog box is displayed for you to select the new drawing style.
In either case, the view (drawing style) can be selected as one of the following:
The styles and the Changing View Options dialog box are described in section "Changing View Options Dialog Box" .
When you drop a main graph on the Scale Icon, you see a dialog box titled Rescaling from which you can change the scale of all the metrics in the main graph. The same dialog box appears when you drag a metric label of a main graph to the Scale Icon.
[Figure] Rescaling Dialog Box, azizoThe Rescaling dialog box identifies the main graph by its title and if the object was a metric label, identifies the metric label by its path name. Where the main graph is the object, any change you select from this dialog box applies to all the metrics in the graph; otherwise only the selected metric is affected.
The dialog box gives you three options for setting the scale of the metric:
When one of the first two options is selected, both parts of the main graph are updated to reflect the change.
In most instances, a main graph represents a subset of the observations available in a recording file. The subset may be defined by a reduced time interval, by a reduced number of metrics, or both. When it is desired to preserve such a subset for later analysis, as a source for creating merged files, or for other reasons, you can use the filtering function of azizo to produce a filtered recording file. Filtering is initiated by dragging the graph area of a main graph to the Filter Icon and dropping it there.
Filtering, thus, is the writing of a subset of the current recording file to a new file, the subset being defined by the set of metrics that are part of the main graph, which you dragged to the filter icon. For example, if the current recording file contains 20 metrics but the main graph shows only five of those, the filtered file contains data values for only five metrics.
Even though the filtered file contains data values for only the metrics that are part of the main graph, the filtered recording file contains all metrics definitions from the original file. By default, it also contains the other control record types that allow the filtered file to be played back by the xmperf program. The default can be changed as described in section "Maintaining Instrument Definitions when Filtering" .
[Figure] Filter Dialog Box, azizoAfter you drop the main graph on the Filter Icon, the Writing Filtered Recording dialog box appears. This dialog box has default values for the lowest and the highest time stamps to be included when data values are copied to the filtered output file. The defaults correspond to the interval covered by the main graph. You can change either time stamp to extend or reduce the time period covered by the filtered output, as long as the time period covers at least 2 seconds.
If you specify a start time lower than that of the oldest data value in the source recording file, copying starts from the beginning of the source file. If you specify an end time higher than that of the youngest data value in the source recording file, copying continues to the end of the source file.
The default file name for the filtered output is the source file name with ".filt " appended. You can change the file name to anything you want. If the file exists, you are asked whether you want to overwrite it.
If the source recording file was produced by xmperf, it includes data that defines the console and instrument(s) from which the recording was produced. Recordings produced by other programs never have console information but always have a grouping of statistics into sets, which would be interpreted as instruments when the file is played back by xmperf.
A single button in the Writing Filtered Recording dialog box allows you to specify whether you want any console and statset definitions in the source recording file to be carried over to the filtered output file. This button only appears if the source file contains more than one set of statistics (statsets) or contains a console definition. For source files produced by xmperf, neither console nor instrument information is retained if you elect to not maintain instrument definitions. For source files produced by other programs, the grouping of statistics into sets is broken. In all cases where you elected not to maintain instrument definitions, the filtered recording contains only one set of statistics.
Note: Annotation files are available with Version 2.2 or later only.
As described in " Annotation Files " , only recording files with names beginning with R. can have annotation files associated with them. Consequently, the azizo program only considers copying and merging of annotation files if the file created by the filtering function follows the recording file naming conventions.
If this is the case, an annotation file is created for the recording file produced by filtering if the original recording file had an associated annotation file or if an annotation file already exists that matches the recording file produced by the filtering.
The new annotation file is created using these steps:
After the new annotation file is created, an editor window is opened for you to make any changes to the resulting annotation file.
The azizo configuration file resides in each user's home directory. The file name is $HOME/azizo.cf . The file contains user defined configurations that provide standardized views to be applied to main graphs. A sample azizo.cf file is shipped in /usr/samples/perfmgr/azizo.cf .
Configurations are named entities that save a customized view of a main graph. Configuration views are used for viewing different recordings in a uniform manner that allows you to immediately compare the data in the recordings.
The configuration file is a binary file that can not be modified by the end user, except through the interface provided by azizo.
The current view of a main graph can be saved by dragging the graph part of the main graph window to the Config Icon. This drag-and-drop operation indicates to azizo that you want to save the "view" of the main graph as a named configuration that can later be recalled and applied to other main graphs. After you drop the drag icon, the Writing Configuration dialog box shown in "Writing Configuration Dialog Box"
[Figure] Writing Configuration Dialog Box, azizoFor the configuration to be saved, you must enter a name for it in the dialog box. If the name you specify already exists, you are given the option of overwriting the existing configuration or changing the name of the new one you want to create.
The dialog box allows you to specify which parts of the combined "view" of the dragged main graph you want to be part of the saved configuration. You can elect to include or exclude the following options:
The Replace Configuration dialog box is displayed when you drag the Config Icon to a main graph. The dialog box contains a list of all the configurations available in your configuration file. If necessary, a scroll bar allows you to scroll in the list of configurations.
[Figure] Replace Configuration Dialog Box, azizoTo use a named configuration to customize the main graph, you can use either of the following methods:
If you decide not to change the view of the main graph, click on Cancel. A click on Cancel after you have dragged a configuration line to the main graph does not undo the effect of the drag,
Each of the lines in the list can also be drawn to the Pit Icon. Each time you do this, the corresponding configuration is deleted from the configuration file and the list is updated.
Because the Replace Configuration dialog box stays open after you have dragged a configuration line to a main graph, it is possible to drag configuration lines to other main graphs than the one you dragged the Config Icon to when the dialog box appeared. Because this seems like a useful facility, it is permitted to do so. It has the side effect, though, that whenever you click on the OK button, the selected configuration line is applied to the last main graph you dragged a configuration line to. Because of this, always use the Cancel button to close the dialog box if you have dragged configuration lines from the box to one or more main graphs.
Named configurations can be deleted from the Replace Configuration dialog box as explained in the section "Applying Configurations" . They can also be deleted from a dialog box titled Delete Configuration. This dialog box appears when you drag the Config Icon to the Pit Icon. Both the Replace Configuration dialog box and the Delete Configuration dialog box contain a list of all configurations in your configuration file.
To delete a configuration view, drag the corresponding line in the dialog box to the Pit Icon. The configuration is deleted and the list of configurations in the dialog box is updated.
When you have no more deletions to do, close the dialog box by clicking on the Cancel button.
A recording file frequently contains more statistics than it is practical to view in a single main graph. The azizo configuration file, when properly customized, allows multiple views of the same data simultaneously.
When applying configuration views, realize that the top level main graph is unlikely to include all the metrics from the recording file. Because of this, any configuration view you apply to the top level main graph may fail to show the metrics that were filtered out when the main graph was created. This same is true if you apply a configuration view to a main graph that you applied a different configuration view to earlier.
Therefore, before applying a configuration view, create another main graph by zooming in on whichever time period you are interested in and selecting the Rescan button. After the new main graph is displayed, apply the configuration view to that graph.
For multiple views of the same data simultaneously, create as many zoomed-in main graphs as you want views. Then apply different configuration views to each main graph. For easy correlation, let all of the zoomed-in main graphs cover the same time period.
The supplied sample configuration file in /usr/samples/perfmgr/azizo.cf has configurations defined for different views of recordings from the "Local System Monitor" and "Comby Style Sample Consoles" and the "Multi-host Monitor" and "Single-host Monitor" skeleton consoles defined in the distributed xmperf configuration file.
Some of the azizo dialog boxes are identical or similar for multiple object types. Such dialog boxes are described in the following sections.
The Print Box appears when you drag a metrics graph from the metrics selection window, the title part of the metrics selection window, or a main graph to the Print Icon and drop it there. In other words, whenever you want to print a graph. The Print Box is used to control printing of the graph. It is divided in two by a vertical separator.
[Figure] Print Box, azizoThe left part of the dialog box has three sections:
When print is directed to a printer, azizo uses a print command defined by the X resource PrintCommand. The command defaults to lp -d. The resulting command line used to print on a printer called "psprint" would then be lp -d psprint followed by a temporary file name created by azizo.
The right part of the dialog box is divided in two by a horizontal separator. The top section gives you a series of ON/OFF options while the bottom section allows you to enter numerical values to control the printing. The on/off options are:
The options that accept numeric input in the bottom part are:
When you have selected the print options you want, click on the OK button to proceed. To cancel the print, click on Cancel.
Printing of graphs is done by capturing the image of the graph as it appears on your display and converting that image to PostScript format. To ensure that the image is correctly captured, the first thing to do when planning to print a graph is to position the graph window so that it is fully visible and does not obscure the Print Icon.
To initiate the printing, drag the graph to the Print Icon. This causes the Print Box to appear. From the dialog box you set the options as explained earlier. After you click on the OK button in the Print Box, the dialog box disappears and azizo waits two seconds before it begins the capture of the graph image you want to print.
The two-second delay allows the X server to refresh the window so that any part of the graph that was obscured by the dialog box is also refreshed. When the two seconds have elapsed, you hear a beep. This beep signals the start of the capture of the graph image. When the capture is completed, another beep sounds.
Anything you do on your screen in the time between the two beeps can potentially cause the print image to be obscured so the output generated by the image capture is corrupted. Therefore, do not use the mouse or keyboard until you hear the second beep.
The Report Box appears when you drag the data part of an information window to the Print Icon and drop it there. In other words, whenever you want to print the tabular view of the statistical data for a main graph or the metrics selection window. The Report Box is used to control printing of the report.
[Figure] Report Box, azizoThe dialog box has three parts:
When print is directed to a printer, azizo uses a print command defined by the X resource PrintCommand. The command defaults to lp -d. The resulting command line used to print on a printer is called "ascprint" would then be lp -d ascprint followed by a temporary file name created by azizo.
After you have changed the fields in the dialog box, click on OK to execute the printing. If you don't want to go through with the printing, click on Cancel.
The generated print file is a plain ASCII file. When you print the information window of the metrics selection window or the top level main graph, the print output contains only one section that lists the statistical data for all the metrics in the object. If the object you drag to the Print Icon is a zoomed-in main graph, the printed report contains two parts: one for the entire time period covered by the recording file; another for the zoomed-in time period. Each part may contain multiple pages.
All Metrics     Page 1
Summary for graph 100%, Dec 20 13:32:19 1993-Dec 20 15:49:10 1993
No of Average Standard
Maximum Minimum
Observ  Value Deviation  Value   Value  Metric pathname
-----  ------  ------- ------ -------
------------------
  774   0.87    3.61   44.80   0.00   hosts/snook/Disk/hdisk0/wblk
  774   0.00    0.06
 1.60   0.00   hosts/snook/Disk/hdisk0/rblk
  774   0.09    0.32
 4.20   0.00
hosts/snook/Disk/hdisk0/xfer
  774   0.11    0.40    5.80   0.00
hosts/snook/Disk/hdisk0/busy
  721   1.77    7.37   89.63   0.00
hosts/nchris/Disk/hdisk1/wblk
  721   0.34    4.19
108.87   0.00   hosts/nchris/Disk/hdisk1/rblk
  721   0.22
0.85   11.41   0.00
hosts/nchris/Disk/hdisk1/xfer
  721   0.49
1.93   26.42   0.00
hosts/nchris/Disk/hdisk1/busy
  721  29.96   96.66  875.38   0.00
  hosts/nchris/Disk/hdisk0/wblk
  721   6.83   87.48
2248.02   0.00   hosts/nchris/Disk/hdisk0/rblk
  721   1.73    3.97   49.80   0.00
hosts/nchris/Disk/hdisk0/xfer
  721   3.42
7.79   86.80   0.00
hosts/nchris/Disk/hdisk0/busy
  777   2.82   10.10
91.20   0.00   hosts/drperf/Disk/hdisk0/wblk
  777   2.95   42.95
1070.44    0.00   hosts/drperf/Disk/hdisk0/rblk
  777   0.46    1.67   19.80   0.00
hosts/drperf/Disk/hdisk0/xfer
  777   1.04    3.91   46.20   0.00
hosts/drperf/Disk/hdisk0/busy
37.68%      Page 1
 Summary for graph 44.66%, Dec 20 13:33:00 1993 - Dec 20 14:34:07
1993
 No of   Average    Standard   Maximum   Minimum
Observ    Value     Deviation    Value    Value      Metric path name
--------  -------  ---------   ---------  ---------  -----------
619      28.44     90.47        875.38    0.00
hosts/nchris/Disk/hdisk0/wblk
619       7.89     94.38       2248.02    0.00
hosts/nchris/Disk/hdisk0/rblk
619       1.76      4.06         49.80    0.00
hosts/nchris/Disk/hdisk0/xfer
619       3.45      7.79         86.80    0.00
hosts/nchris/Disk/hdisk0/busy
         100%      Page 2
 Summary for graph 100%, Dec 20 13:32:19 1993 - Dec 20 15:49:10
1993
 No of  Average   Standard   Maximum   Minimum
Observ    Value   Deviation    Value     Value   Metric path name
-------- --------- --------- --------- --------- ------------
  721    29.96      96.66    875.38     0.00
hosts/nchris/Disk/hdisk0/wblk
  721     6.83      87.48   2248.02     0.00
hosts/nchris/Disk/hdisk0/rblk
  721     1.73       3.97     49.80     0.00
hosts/nchris/Disk/hdisk0/xfer
  721     3.42       7.79     86.80     0.00
hosts/nchris/Disk/hdisk0/busy
The purpose of the Changing View Options dialog box is to allow you to change the way one or all metrics are plotted in an object. The dialog box is displayed when you drag one of the following object types to the View Icon:
The dialog box has two incarnations. The first is displayed when the drag object comes from a main graph; the second when the object is part of the metrics selection window. The dialog box identifies the object you dragged to the View Icon on the first text line in the box. The next two lines further point out the type of the selected object. The remaining lines give a brief explanation of the available view styles. The row of buttons at the bottom allows you to select the view style you want or to keep the current view style by clicking on the Cancel button.
To understand how the view style is affected by the available data, consider that each metric is drawn from an array of observations where each element in the array corresponds to a time interval into which a single observation, multiple observations, or none of those in the recording file may fit. Only if the time interval covers multiple observations can there be a difference between plotting the maximum value, the minimum value, or the average value in the interval.
[Figure] Change View Options Dialog Box, azizo Main GraphsThe incarnation of the dialog box when the object is a main graph or a single metric label from a main graph is has the following view types, all of which are drawn as line graphs:
If the object is a single metrics graph from the metrics selection window or the title part of the metrics selection window, the view types available are:
The drag and drop interface of azizo may be new and strange to some users. This section is intended to be used as a reference section and may be useful to such users. It contains subsections for each of the objects and actions defined by azizo. Where applicable, each subsection describes:
The Annotate Icon, available with Version 2.2 or later, is used to add or modify annotation text to a recording. Annotation text is kept in a separate file, linked to the recording file by a naming convention, as explained in "Annotation Files " .
The Config Icon is used to save, retrieve, and delete customized views of main graphs. The idea is that by saving a particular view, you can later use it for viewing other recordings and display the graphs in a way that allows you to immediately compare the data in the recordings. Each saved view is called a configuration. The Config Icon is used to maintain and use configurations.
Configuration lines are the detail lines in the dialog boxes Delete Configuration and Replace Configuration. Each line represents a named configuration view as it is saved in the configuration file. To use a configuration line as a drag object, place the pointer on the line and start the drag operation from there. Nothing can be dropped on configuration lines.
The Exit Icon allows you to exit the azizo program. The only drag-and-drop operation permitted for this icon is to drag the icon to the Help Icon to display a help text.
The Filter Icon is used when you want to produce a filtered recording file as a subset of the current recording file. The only place where the Filter Icon can be dropped is the Help Icon.
The Help Icon is the entry point to the help facility. It is the only icon that can not be dragged anywhere. If you click on the Help Icon, the help index is displayed.
The Info Icon is used to display summary information for either a single metric or all metrics in a main graph or in the metrics selection window. The only place where the Info Icon can be dropped is the Help Icon. Doing so gives you a help text for the Info Icon.
Information windows that are generated from a main graph or from all the metrics in the metrics selection window can be used as objects. No objects can be dropped on information windows.
This icon is used to select a recording file to analyze. When you click on the icon, the Select Recording File selection box is displayed. No objects can be dragged to the Local Files Icon. The only place where the Local Files Icon can be dropped is the Help Icon. Doing so gives you a help text for the Local Files Icon.
Main graphs can be used as objects that can be dragged to and dropped on actions. Selected other objects can be dragged to main graphs. To drag a main graph, start the drag operation with the pointer in the graph section of the main graph window. Similarly, when objects are dropped onto a main graph, the point where you drop the object must be within the graph area.
A metric label represents a single metric of a main graph. Any action performed when dropping a metric label onto an icon affects only the metric represented by the metric label and only in the main graph from where the metric label is dragged. Nothing can be dropped on a metric label.
A metrics graph is the graphical representation of the values for a single statistic as shown in the metrics selection window. The metrics graph is intended to give users a visual representation of how the observed values for the statistic have varied over the time period covered by the graph. When a metrics graph is dropped on an action, the action is applied only to the metric represented by the metrics graph. Other metrics in the metrics selection window are unchanged. No objects can be dropped on a metrics graph.
Even though the metric no longer seems to be available, it is not completely forgotten: If you zoom-in on a main graph and select the Rescan option, then the recording file is scanned for all metrics that have observations within the zoom-in outline. If the metric you deleted from the metrics selection window meets the criterias for being included in the zoomed-in graph, then it is included regardless of it no longer being accessible from the metrics selection window.
The metrics selection window consists of a title part followed by a list of metrics graphs. The title part is an object and can be dropped on various actions. When this is done, the action is performed on all the metrics in the metrics selection window. No objects can be dropped on the metrics selection window.
The generated print image contains the entire metrics selection window, including scroll bars, if present, and including the title part of the window. Only those metrics graphs visible in the window when printing starts are included in the print image.
The Pit Icon is where you drop objects you no longer need. This causes the object you drop to be removed from where you dragged it but never causes changes to the recording file. Removal of objects, thus, is only from the viewing environment you are in. It is always possible to start over by re-reading the recording file. When you drag configuration lines to the Pit Icon, however, you permanently delete the named configuration from the configuration file. The only place where the Pit Icon can be dropped is the Help Icon.
The metric can not be added back to the metrics selection window except by rereading the recording file. However, if you use the Rescan option when zooming in on a main graph, the deleted metric again is included in the scan, because the scan is done on the actual file rather than from the metrics selection window.
The Print Icon is where you drop objects you want to print. This causes either the Print Box or the Report Box to appear. The former when the object is a graph; the latter when the object is an information window. The only place where the Print Icon can be dropped is the Help Icon.
When printing graphs, azizo first captures the image of the graph, then converts the image to PostScript format, and finally sends the print file to a printer or a file. The capture of the image depends on the graph being visible on the screen as explained in the section "How Graphs Are Printed" .
The Scale Icon is used to change the scale for one or more metrics in a main graph. This is done by dragging an object to the icon. The only place where the Scale Icon can be dropped is the Help Icon.
The View Icon is used to change the way one or more metrics is plotted in the graph where it appears. This is done by dragging a metrics object, a main graph, or the title part of the metrics selection window onto the icon. The only place where the View Icon can be dropped is the Help Icon.