This section contains information on setting breakpoints, viewing and modifying global data, displaying registers, and using the stack trace.
Setting a breakpoint is essential for debugging kernel or kernel extensions. To set a breakpoint, use the following sequence of steps:
The process of locating the assembler instruction and getting its offset is explained in the previous section. The next step is to get the address where the kernel extension is loaded.
To determine the address where a kernel extension has been loaded, use the following procedure. First, find the load point (the entry point) of the executable kernel extension. This is a label supplied with the -e option for the ld (links objects) command used while generating the kernel extension. In our example this is the democonfig routine.
Then use one of the following six methods to locate the address of this load point. This address is the location where the kernel extension is loaded.
If the kernel extension is a device driver, use the drivers command to locate the address of the load point routine. The drivers command lists all the function descriptors and the function addresses for the device driver (that are in the dev switch table). Usually the config routine will be the load point routine. Hence in our example the function address for the config (democonfig) routine is the address where the kernel extension is loaded.
| > drivers 255 | |||||
| MAJ#255 | Open | Close | Read | Write | |
| func | desc | 0x01B131B0 | 0x01B131BC | 0x01B131C8 | 0x01B131D4 |
| func | addr | 0x01B12578 | 0x01B126A0 | 0x01B127D4 | 0x01B12910 |
| Ioctl | Strategy | Tty | Select | ||
| func | desc | 0x00019F10 | 0x00019F10 | 0x00000000 | 0x00019F10 |
| func | addr | 0x00019A20 | 0x00019A20 | 0x00019A20 | |
| Config | Dump | Mpx | |||
| func | desc | 0x01B131A4 | 0x00019F10 | 0x00019F10 | 0x00019F10 |
| func | addr | 0x01B121EC | 0x00019A20 | 0x00019A20 | 0x00019A20 |
| Revoke | Dsdptr | Selptr | Opts | ||
| func | desc | 0x00019F10 | 0x00000000 | 0x00000000 | 0x00000002 |
| func | addr | 0x00019A20 | |||
Another method to locate the address is to use the value of the kmid pointer returned by the sysconfig(SYS_KLOAD) subroutine when loading the kernel extension. The kmid pointer points to the address of the load point routine. Hence to get the address of the load point, print the kmid value during the sysconfig call from the configuration method. Then go into the low level debugger and display the value pointed to by kmid. For clarity, set mnemonics for kmid.
> set kmid 1b131a4
> vars
Listing of the User-defined variables:
  kmid HEX=01B131A4
  fx HEX/DEC=01B1256E
  org
There are 15 free variable slots.
> d kmid
01B131A4   01B121EC 01B131E0 00000000 01B12578
|..!...1.......%x|
> d kmid>
01B121EC   7C0802A6 BFC1FFF8 90010008 9421FF80
||............!..|
If kmid is also not known, use the find command to locate the load point routine:
> find democonfig 1b00000
01B1256E   66616B65 636F6E66 69677C08 02A693E1
|democonfig|.....|
The find command will locate the specified string. It initiates a search from the starting address specified in the command. The string that is located is at the end of the democonfig routine. Now, backup to locate the beginning of the routine.
Usually all procedures have the instruction 7C0802A6 within the first three or four instructions of the procedure (within the first 12 to 16 bytes). See the assembler listing for the actual position of this instruction within the procedure. Use the screen command with the - flag to keep going back to locate the instruction. You can help speed up your search by using the ASCII section of the screen output to look for occurrences of the pipe symbol (|), which corresponds to the hexadecimal value 7C, the first byte of the instruction. Once this instruction is found, you can figure out where the start of the procedure is using the assembler listing as a guide.
> screen fx
GPR0  000078E4   2FF7FF70  000C5E78 00000000 2FF7FFF8  00000000 00007910 DEADBEEF
GPR8  DEADBEEF   DEADBEEF  DEADBEEF 7C0802A6 DEADBEEF  DEADBEEF DEADBEEF DEADBEEF
GPR16 DEADBEEF   DEADBEEF  DEADBEEF DEADBEEF DEADBEEF  DEADBEEF DEADBEEF DEADBEEF
GPR24 DEADBEEF   DEADBEEF  DEADBEEF DEADBEEF DEADBEEF  DEADBEEF DEADBEEF 00007910
MSR   000090B0   CR     00000000  LR    0002506C  CTR  000078E4
MQ    00000000   XER    00000000  SRR0  000078E4  SRR1 000090B0 DSISR    40000000
DAR   30000000   IAR    000078E4  (ORG+000078E4)  ORG=00000000  Mode:    VIRTUAL
000078E0     00000000   48000000  4E800020   00000000  |....H...N.. ....|
                       |          b  0x78E4  (000078E4)
000078F0     000C0000   00000000  00000000   00000000  |................|
                               |
01B12560     80020301   00000000  0000036C   000A6661  |...........l..fa|
01B12570     6B65636F   6E666967  7C0802A6   93E1FFFC  |keconfig|.......|
01B12580     90010008   9421FFA0  83E20000   90610078  |.....!.......a.x|
01B12590     9081007C   90A10080  90C10084   307F0294  |...|........0...|
01B125A0     48000535   80410014  80610078   5463043E  |H..5.A...a.xTc.>|
01B125B0     90610038   80610078  48000491   9061003C  |.a.8.a.xH....a.<|
01B125C0     28830000   41860020  8061003C   88630004  |(...A.. .a.<.c..|
> screen -
.
.
>
>
GPR0  000078E4 2FF7FF70  000C5E78  00000000  2FF7FFF8  00000000 00007910 DEADBEEF
GPR8  DEADBEEF DEADBEEF  DEADBEEF  7C0802A6  DEADBEEF  DEADBEEF DEADBEEF DEADBEEF
GPR16 DEADBEEF DEADBEEF  DEADBEEF  DEADBEEF  DEADBEEF  DEADBEEF DEADBEEF DEADBEEF
GPR24 DEADBEEF DEADBEEF  DEADBEEF  DEADBEEF  DEADBEEF  DEADBEEF DEADBEEF 00007910
MSR   000090B0 CR    00000000  LR      0002506C   CTR  000078E4 MQ       00000000
XER   00000000 SRR0   000078E4 SRR1    000090B0   DSISR40000000 DAR      30000000
IAR   000078E4 (ORG+000078E4)  ORG=00000000 Mode: VIRTUAL
000078E0    00000000 48000000  4E800020     00000000  |....H...N.. ....|
                      |         b  0x78E4   (000078E4)
000078F0    000C0000 00000000  00000000     00000000  |................|
                         |
01B121E0    00000000 00000000  00000000     7C0802A6  |............|...|
01B121F0    BFC1FFF8 90010008  9421FF80     83E20000  |.........!......|
01B12200    90610098 9081009C  90A100A0     307F0040  |.a..........0..@|
01B12210    80810098 480008C1  80410014     307F0058  |....H....A..0..X|
01B12220    83C20008 63C40000  80A2000C     80C20010  |....c...........|
01B12230    480008A5 80410014  63C30000     80810098  |H....A..c.......|
01B12240    5484043E 90810038  38800000     9081003C  |T..>...88......<|
The start of the democonfig routine is at 0x01B121EC.
If the load point routine is an exported routine, use the map command to locate the appropriate routine:
>map <routine name>
You can also use the crash command to locate the load point. After running the crash command, run the le subcommand to list the load point for all the kernel extensions. The knlist subcommand will list the addresses of exported symbols:
$ crash
>le
>quit
The le subcommand shows the module start address. The first procedure in the kernel extension would follow the module header from the module start address. Hence in the case of the example demodd kernel extension, le showed the module start address to be 0x01B12000 and the democonfig procedure starts at 0x01B121EC.
You can locate the start of the democonfig procedure by searching for the first instruction of the democonfig procedure which would be usually 0x7C0802A6. Use the assembler listing to determine the first instruction.
First, display memory at 0x01b12000 and then use the screen subcommand to search ahead.
>screen 01b12000
>screen +
.
.
Use the find command to search for a pattern:
> find democonfig 1b00000
01B1256E   66616B65 636F6E66 69677C08 02A693E1
|democonfig|.....|
We know that the module starts before 1B1256E. We also know that the "magic" number is 01DF. The loader identifies a file as a load module by looking for 01DF as the first two bytes in the file. So, the greatest address which is less than 1B1256E that contains 01DF, will be the start of the module, provided that it is on a page boundary. This means it has a mask of FFFFF000, a 4096 boundary or 0x1000:
> find 01df 01900000 * 2
Search starting at 1900000 through the kernel storage (the *) for 01DF on a 2-byte boundary.
The greatest address, on a page boundary, that is less than 1B1256E will be the module start. This will be offset 00000000 in the map file.
Set the origin to the address of the load point. By default this is zero. By changing the origin to the address of the load point, you can directly correlate the address in the assembler listing with the address for the Instruction Address Register (IAR) and break points.
>set fkcfg 1B121EC       set a variable called fkcfg

>origin fkcfg
Now set the break point with the break command. Assume that we want to set the breakpoint at the assembler instruction at offset 218 (using the assembler listing):
>break +218 If origin has been set to load point
>break 1B121EC+218
You can access the global data with two different methods. To understand how to locate the address of a global variable, we use the example of our demodd device driver. Here we try to view and modify the value of the data[ ] character array in the sample demodd device driver.
Use the first method only when you break in a procedure for the kernel extension to be debugged. You can use the second method at any time.
The map file shows that the address of the data[ ] array is at 0x53C while the TOC is at 0x52C. The offset of the address of the data[ ] array with respect to the start of TOC is 0x53C - 0x52C = 0x10. Hence the address of the data[ ] variable is at (r2+10). And the actual data[ ] variable is located at the address value in (r2 + 10):
> d r2
01B131E0 01B12CCC 0004E7D0 01B13114 01B1311C |..,.......1...1.|
> d r2+10>
01B13124 61626364 65666768 696A6B6C 6D6E6F70 |abcdefghijklmnop|
Now we can change the value of the data[] variable. As an example, we change the first four bytes of data[ ] to "pppp" (p = 70):
> st r2+10> 70707070
> d r2+10>
01B13124 70707070 65666768 696A6B6C 6D6E6F70 |ppppefghijklmnop|
You can use this method at any time. This method requires the map file and the address at which the relevant kernel address has been loaded. This method currently works because of the manner in which a kernel extension is loaded. But it may not work if the procedure for loading a kernel extension changes.
The address of a variable is:
The following is the section of the map file showing the data[ ] variable and the last function (xmfree) in the .text section:
26     000009B4 000024  2 GL SD S23  <.devswadd>  glink.s(/usr/lib/glink.o)
27     000009B4           GL LD S24  .devswadd
28     000009D8 000024  2 GL SD S25  <.devswdel>  glink.s(/usr/lib/glink.o)
29     000009D8           GL LD S26  .devswdel
30     000009FC 000024  2 GL SD S27  <.xmfree>    glink.s(/usr/lib/glink.o)
31     000009FC           GL LD S28  .xmfree
32     00000000 000444  4 RW SD S29  <_/tmp/cliff/demodd/demodd$c$>
/tmp/cliff/demodd/demodd.c(demodd.o)
33     00000450 000004  4 RW SD S30  demo_dev
/tmp/cliff/demodd/demodd.c(demodd.o)
34     00000460 000004  4 RW SD S31  demos_inited
/tmp/cliff/demodd/demodd.c(demodd.o)
35     00000470 000080  4 RW SD S32  data
/tmp/cliff/demodd/demodd.c(demodd.o)
36 * E 000004F0 00000C  2 DS SD S33  democonfig
/tmp/cliff/demodd/demodd.c(demodd.o)
37   E 000004FC 00000C  2 DS SD S34  demoopen
/tmp/cliff/demodd/demodd.c(demodd.o)
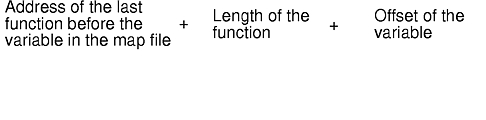
The last function in the .text section is at lines 30-31. The offset address of this function from the map is 0x000009FC (line 30, column 2). The length of the function is 0x000024 (line 30, column 3). The offset address of the data[ ] variable is 0x000000470 (line 35, column 2). Hence the offset of the address of the data[ ] variable is:
0x000009FC + 0x000024 + 0x00000470 = 0x00000E90
Add this address value to the load point value of the demodd kernel extension. If, as in the case of the sample demodd device handler, this is 0x1B131A4, then the address of the data[ ] variable is:
0x1B121EC + 0x00000E90 = 0x1B1307C

>display 1B1307C
01B1307C  61626364 65666768 696A6B6C 6D6E6F70  |abcdefghijklmnop|
Now change the value of the data[ ] variable as in Method 1.
Note that in Method 1, using the TOC, you found the address of the address of data[ ], while in Method 2 you simply found the address of data[ ].
When you write a device driver for a new Micro Channel adapter, you often want to be able to read and write to registers that reside on the adapter. This is a way of seeing if the hardware is functioning correctly. For example, to examine a register on the Token Ring adapter, first see where this adapter resides in the bus I/O space:
$lsdev -C

sys0        Available 00-00 System Object
sysunit0    Available 00-00 System Unit
sysplanar0  Available 00-00 CPU Planar
.
.
scsi0       Available 00-01 SCSI I/O Controller
tok0        Available 00-02 Token-Ring High-Performance Adapter
ent0        Available 00-03 Ethernet High-Performance LAN Adapter


$lsattr -l tok0 -E

bus_intr_lvl           3    Bus interrupt level   False
intr_priority          3    Interrupt priority    False
.
.
rdto        92         RECEIVE DATA TRANSFER OFFSET       True
bus_io_addr 0x86a0     Bus I/O address                    False
dma_lvl     0x5        DMA arbitration level              False
dma_bus_mem 0x202000   Address of bus memory used DMA     False
We now know that the token ring adapter is located at 0x86A0.
To read a specific register, enter the kernel debugger and use the sregs command to display the segment registers. Find an unused segment register (=007FFFFF). For this example, assume s9 is not used. Enable the Micro Channel bus addressing with the set command:
set s9 820c0020
Use the sregs command to display the segment register values to check that you typed it in correctly.
From the POWERstation and POWERserver Hardware Technical Information-Options and Devices, we know that the address of the Adapter Communication and Status register is P6a6. The value of P is based on the Bus I/O address (bus_io_addr) of the adapter. In the above example, this is 86A0. It could have been anything from 86A0 to F6A0 on a 0x1000 byte boundary. Hence P is 8, and the address of the Communication and Status register is 86A6. The display command now displays the two-byte register:
d 900086a6 2
The key is to load a segment register with 820c0020 and then use that segment register to reference registers and memory on your adapter. You can use the same method to access registers resident on the IOCC. In that case, load the segment register with a value of 820c00e0.
The stack trace gives the stack history which provides the sequence of procedure calls leading to the current IAR. The Ret Addr is the address of the instruction calling this procedure. You can use the map file to locate the name of the procedure. Note that the first stack frame shown is almost always useless, since data either has not been saved yet, or is from a previous call. The last function preceding the Ret Addr is the function that called the procedure.
You can also use the map command to locate the function name if the function was exported. The map <addr> command locates the symbol before the given address. The following is a concise view of the stack:
    Low                     |                    |Stack grows at
    Addresses          |                    |this end.
                            |--------------------|
    Callee's stack ->  0    |     Back chain     |
    pointer            4    |      Saved CR      |
                       8    |      Saved LR      |
                    12-16   |      Reserved      |<---LINK AREA (callee)
                      20    |      SAVED TOC     |
                            |--------------------|
    Space for P1-P8         |         P1         |  OUTPUT ARGUMENT AREA
    is always reserved |        ...         |<---(Used by callee to
                            |         Pn         |    construct argument
                            |      Callee's      |
                            |       stack        | <--- LOCAL STACK AREA
                            |        area        |
                            |--------------------|
                            |                    | (Possible word wasted
                            |--------------------|    for alignment.)
    -8*nfprs-4*ngprs -->    |   Caller's GPR     | Rfirst = R13 for full
    save                    |     save area      |          save
                            |    max 19 words    | R31
                            |--------------------|
    -8*nfprs -->            |   Caller's FPR     | Ffirst = F14 for a
                            |     save area      |          full save
                            |   max 18 dblwds    | F31
                            |--------------------|
    Caller's stack ->  0    |     Back chain     |
    pointer            4    |      Saved CR      |
                       8    |      Saved LR      |
                    12-16   |      Reserved      |<---LINK AREA (caller)
                       20   |      Saved TOC     |
                            |--------------------|
    Space for P1-P8    24   |         P1         |  INPUT PARAMETER AREA
    is always reserved |        ...         | <---(Callee's input
                            |         Pn         |     parameters found
                            |--------------------|      here. Is also
                            |      Caller's      |   caller's arg area.)
                            |       stack        |
    High                    |        area        |
    Addresses          |
The following is a sample stack history with a break in the sample demodd kernel extension. The breakpoint was set at the start of the demoread routine at 0x1B127D4 (Beginning IAR). This was called from an instruction at 0x000824B0 (Ret Addr). This in turn is called by the instruction at address 0x00085F54 (Ret Addr), and so on.
The low values of the addresses (0x000824B0 and 0x00085F54) suggest that the instructions are in /unix. You can use the crash command and the le subcommand to determine the right kernel extension that is loaded in an address range.