The AIX trace facility is useful for observing a running device driver and system. The trace facility captures a sequential flow of time-stamped system events, providing a fine level of detail on system activity. Events are shown in time sequence and in the context of other events. The trace facility is useful in expanding the trace event information to understand who, when, how, and even why the event happened.
The operating system is shipped with permanent trace event points. These events provide general visibility to system execution. You can extend the visibility into applications by inserting additional events and providing formatting rules.
Care was taken in the design and implementation of this facility to make the collection of trace data efficient, so that system performance and flow would be minimally altered by activating trace. Because of this, the facility is extremely useful as a performance analysis tool and as a problem determination tool.
The trace facility is more flexible than traditional system monitor services that access and present statistics maintained by the system. With traditional monitor services, data reduction (conversion of system events to statistics) is largely coupled to the system instrumentation. For example, the system can maintain the minimum, maximum, and average elapsed time observed for runs of a task and permit this information to be extracted.
The trace facility does not strongly couple data reduction to instrumentation, but provides a stream of system events. It is not required to presuppose what statistics are needed. The statistics or data reduction are to a large degree separated from the instrumentation.
You can choose to develop the minimum, maximum, and average time for task A from the flow of events. But it is also possible to extract the average time for task A when called by process B, extract the average time for task A when conditions XYZ are met, develop a standard deviation for task A, or even decide that some other task, recognized by a stream of events, is more meaningful to summarize. This flexibility is invaluable for diagnosing performance or functional problems.
The trace facility generates large volumes of data. This data cannot be captured for extended periods of time without overflowing the storage device. This allows two practical ways that the trace facility can be used natively.
First, the trace facility can be triggered in multiple ways to capture small increments of system activity. It is practical to capture seconds to minutes of system activity in this way for post-processing. This is sufficient time to characterize major application transactions or interesting sections of a long task.
Second, the trace facility can be configured to direct the event stream to standard output. This allows a realtime process to connect to the event stream and provide data reduction in real-time, thereby creating a long term monitoring capability. A logical extension for specialized instrumentation is to direct the data stream to an auxiliary device that can either store massive amounts of data or provide dynamic data reduction.
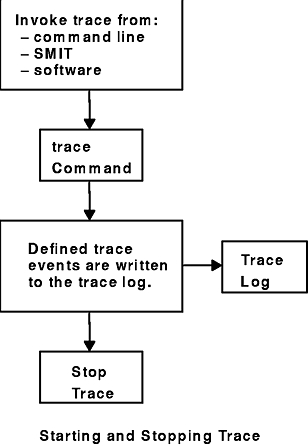
You can start the system trace from:
As shown in the Starting and Stopping Trace figure, the trace facility causes predefined events to be written to a trace log. The tracing action is then stopped. Tracing from a command line is discussed in "Controlling trace" . Tracing from a software application is discussed and an example is presented in "Examples of Coding Events and Formatting Events".
After a trace is started and stopped, you must format it before viewing it. This is illustrated in the Trace Formatting figure. To format the trace events that you have defined, you must provide a stanza that describes how the trace formatter is to interpret the data that has been collected. This is described in "Syntax for Stanzas in the trace Format File".
The trcrpt command provides a general purpose report facility. The report facility provides little data reduction, but converts the raw binary event stream to a readable ASCII listing of the event stream. Data can be visually extracted by a reader, or tools can be developed to further reduce the data.
For an event to be traced, you must write an event hook (sometimes called a trace hook) into the code that you want to trace. Tracing can be done on either the system channel (channel 0) or on a generic channel (channels 1-7). All preshipped trace points are output to the system channel.
Usually, when you want to show interaction with other system routines, use the system channel. The generic channels are provided so that you can control how much data is written to the trace log. Only your data is written to one of the generic channels.
For more information on trace hooks, see "Macros for Recording trace Events.
The following sections describe the use of the trace facility.
The trace command configures the trace facility and starts data collection. The syntax of this command is:
trace [ -a | -f | -l ] [ -c ] [ -d ] [ -h ] [ -j Event [ ,Event ] ] [ -k Event [ ,Event ] ] [ -m Message ] [ -n ] [ -o OutName ] [ -o- ] [ -s ] [ -L Size ] [ -T Size ] [-1234567]
The various options of the trace command are:
You can also start trace from a the command line or with a trcstart subroutine call. The trcstart subroutine is in the librts.a library. The syntax of the trcstart subroutine is:
int trcstart(char *args)
where args is simply the options list desired that you would enter using the trace command if starting a system trace (channel 0). If starting a generic trace, include a -g option in the args string. On successful completion, trcstart returns the channel ID. For generic tracing this channel ID can be used to record to the private generic channel.
For an example of the trcstart routine, see the sample code.
When compiling a program using this subroutine, you must request the link to the librts.a library. Use -l rts as a compile option.
Once trace is configured by the trace command or the trcstart subroutine, controls to trace trigger the collection of data on, trigger the collection of data off, and stop the trace facility (stop deconfigures trace and unpins buffers). These basic controls exist as subcommands, commands, subroutines, and ioctl controls to the trace control device, /dev/systrctl. These controls are described in the following sections.
If the trace routine is configured without the -a option, it runs in subcommand mode. Instead of the normal shell prompt, -> is the prompt. In this mode the following subcommands are recognized:
The following is an example of a trace session in which the trace subcommands are used. First, the system trace points have been displayed. Second, a trace on the system calls have been selected. Of course, you can trace on more than one trace point. Be aware that trace takes a lot of data. Only the first few lines are shown in the following example:
# trcrpt -j |pg
004     TRACEID IS ZERO
100     FLIH
200     RESUME
102     SLIH
103     RETURN FROM SLIH
101     SYSTEM CALL
104     RETURN FROM SYSTEM CALL
106     DISPATCH
10C     DISPATCH IDLE PROCESS
11F     SET ON READY QUEUE
134     EXEC SYSTEM CALL
139     FORK SYSTEM CALL
107     FILENAME TO VNODE (lookuppn)
15B     OPEN SYSTEM CALL
130     CREAT SYSTEM CALL
19C     WRITE SYSTEM CALL
163     READ SYSTEM CALL
10A     KERN_PFS
10B     LVM BUF STRUCT FLOW
116     XMALLOC size,align,heap
117     XMFREE address,heap
118     FORKCOPY
11E     ISSIG
169     SBREAK SYSTEM CALL

# trace -d -j 101 -m "system calls trace example"
-> trcon
-> !cp /tmp/xbugs .
-> trcoff
-> quit
# trcrpt -O "exec=on,pid=on" > cp.trace
# pg cp.trace
pr  3 11:02:02 1991
System: AIX smiller Node: 3
Machine: 000247903100
Internet Address: 00000000 0.0.0.0
system calls trace example
trace -d -j 101 -m -m system calls trace example

ID  PROCESS NAME PID  I ELAPSED_SEC  DELTA_MSEC APPL SYSCALL

001 trace       13939   0.000000000 0.000000     TRACE ON chan 0
101 trace       13939   0.000251392 0.251392     kwritev
101 trace       13939   0.000940800 0.689408     sigprocmask
101 trace       13939   0.001061888 0.121088     kreadv
101 trace       13939   0.001501952 0.440064     kreadv
101 trace       13939   0.001919488 0.417536     kioctl
101 trace       13939   0.002395648 0.476160     kreadv
101 trace       13939   0.002705664 0.310016     kioctl
If you configure the trace routine to run asynchronously (the -a option), you can control the trace facility with the following commands:
| trcon | Triggers collection of trace data on. |
| trcoff | Triggers collection of trace data off. |
| trcstop | Stops collection of trace data (like trcoff) and terminates the trace routine. |
The controls for the trace routine are available as subroutines from the librts.a library. The subroutines return zero on successful completion. The subroutines are:
| trcon | Triggers collection of trace data on. |
| trcoff | Triggers collection of trace data off. |
| trcstop | Stops collection of trace data (like trcoff) and terminates the trace routine. |
The subroutines for controlling trace open the trace control device (/dev/systrctl), issue the appropriate ioctl command, close the control device and return. To control tracing around sections of code, it can be more efficient for a program to issue the ioctl controls directly. This avoids the unnecessary, repetitive opening and closing of the trace control device, at the expense of exposing some of the implementation details of trace control. To use the ioctl call in a program, include sys/trcctl.h to define the ioctl commands. The syntax of the ioctl is as follows:
ioctl (fd, CMD, Channel)
| fd | File descriptor returned from opening /dev/systrctl |
| CMD | TRCON, TRCOFF, or TRCSTOP |
| Channel | Trace channel (0 for system trace). |
The following code sample shows how to start a trace from a program and only trace around a specified section of code:
#include <sys/trcctl.h>
extern int trcstart(char *arg);
char *ctl_dev ="/dev/systrctl";
int ctl_fd
main()
{
        printf("configuring trace collection \n");
        if (trcstart("-ad")){
        perror("trcstart");
                exit(1);
        }
        if((ctl_fd =open (ctl_dev))<0){
                perror("open ctl_dev");
                exit(1);
        }
        printf("turning trace collection on \n");
        if(ioctl(ctl_fd,TRCON,0)){
                perror("TRCON");
                exit(1);
        }
        /* code between here and trcoff ioctl will be traced */
        printf("turning trace off\n");
        if (ioctl(ctl_fd,TRCOFF,0)){
                perror("TRCOFF");
                exit(1);
        }
        exit(0);
}
A trace report facility formats and displays the collected event stream in readable form. This report facility displays text and data for each event according to rules provided in the trace format file. The default trace format file is /etc/trcfmt and contains a stanza for each event ID. The stanza for the event provides the report facility with formatting rules for that event. This technique allows you to add your own events to programs and insert corresponding event stanzas in the format file to have their new events formatted.
This report facility does not attempt to extract summary statistics (such as CPU utilization and disk utilization) from the event stream. This can be done in several other ways. To create simple summaries, consider using awk scripts to process the output obtained from the trcrpt command.
The syntax of the trcrpt command is as follows:
trcrpt [ -c ] [ -d List ] [ -e Date ] [ -h ] [ -j ] [ -k List ] [ -n Name ] [ -o File ] [ -p List ] [ -q ] [ -r ] [ -s Date ] [ -t File ] [ -v ] [ -O Options] [ -T List ] [ LogFile ]
Normally the trcrpt output goes to standard output. However, it is generally more useful to redirect the report output to a file. The options are:
The operating system is shipped with predefined trace hooks (events). You need only activate trace to capture the flow of events from the operating system. You may want to define trace events in your code during development for tuning purposes. This provides insight into how the program is interacting with the system. The following sections provide the information that is required to do this.
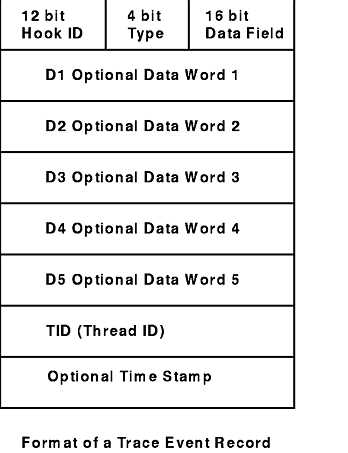
A trace event can take several forms. An event consists of a
The Format of a Trace Event Record figure illustrates a trace event. A four-bit type is defined for each form the event record can take. The type field is imposed by the recording routine so that the report facility can always skip from event to event when processing the data, even if the formatting rules in the trace format file are incorrect or missing for that event.
An event record should be as short as possible. Many system events use only the hookword and timestamp. There is another event type you should seldom use because it is less efficient. It is a long format that allows you to record a variable length of data. In this long form, the 16-bit data field of the hookword is converted to a length field that describes the length of the event record.
There is a macro to record each possible type of event record. The macros are defined in the sys/trcmacros.h header file. The event IDs are defined in the sys/trchkid.h header file. Include these two header files in any program that is recording trace events. The macros to record system (channel 0) events with a time stamp are:
Similarly, to record non-time stamped system events (channel 0), use the following macros:
There are only two macros to record events to one of the generic channels (channels 1-7). These are:
These macros record a hookword (hw), a data word (d1) and a length of data (len) specified in bytes from the user's data segment at the location specified (buf) to the event stream specified by the channel (ch).
Event IDs are 12 bits (or 3-digit hexadecimal), for a possibility of 4096 IDs. Event IDs that are permanently left in and shipped with code need to be permanently assigned. Permanently assigned event IDs are defined in the sys/trchkid.h header file.
To allow you to define events in your environments or during development, a range of event IDs exist for temporary use. The range of event IDs for temporary use is hex 010 through hex 0FF. No permanent (shipped) events are assigned in this range. You can freely use this range of IDs in your own environment. If you do use IDs in this range, do not let the code leave your environment.
Permanent events must have event IDs assigned by the current owner of the trace component. You should conserve event IDs because they are limited. Event IDs can be extended by the data field. The only reason to have a unique ID is that an ID is the level at which collection and report filtering is available in the trace facility. An ID can be collected or not collected by the trace collection process and reported or not reported by the trace report facility. Whole applications can be instrumented using only one event ID. The only restriction is that the granularity on choosing visibility is to choose whether events for that application are visible.
A new event can be formatted by the trace report facility (trcrpt command) if you create a stanza for the event in the trace format file. The trace format file is an editable ASCII file. The syntax for a format stanzas is shown in "Syntax for Stanzas in the trace Format File". All permanently assigned event IDs should have an appropriate stanza in the default trace format file shipped with the base operating system.
The intent of permanent events is to give an adequate level of visibility to determine execution, and data flow, and have an adequate accounting for how CPU time is being consumed. During code development, it can be desirable to make very detailed use of trace for a component. For example, you can choose to trace the entry and exit of every subroutine in order to understand and tune pathlength. However, this would generally be an excessive level of instrumentation to ship for a component.
We suggest that you consult a performance analyst for decisions regarding what events and data to capture as permanent events for a new component. The following paragraphs provide some guidelines for these decisions.
Events should capture execution flow and data flow between major components or major sections of a component. For example, there are existing events that capture the interface between the virtual memory manager and the logical volume manager. If work is being queued, data that identifies the queued item (a handle) should be recorded with the event. When a queue element is being processed, the "dequeue" event should provide this identifier as data also, so that the queue element being serviced is identified.
Data or requests that are identified by different handles at different levels of the system should have events and data that allow them to be uniquely identified at any level. For example, a read request to the physical file system is identified by a file descriptor and a current offset in the file. To a virtual memory manager, the same request is identified by a segment ID and a virtual page address. At the disk device driver level, this request is identified as a pointer to a structure which contains pertinent data for the request.
The file descriptor or segment information is not available at the device driver level. Events must provide the necessary data to link these identifiers so that, for example, when a disk interrupt occurs for incoming data, the identifier at that level (which can simply be the buffer address for where the data is to be copied) can be linked to the original user request for data at some offset into a file.
Events should provide visibility to major protocol events such as requests, responses, acknowledgements, errors, and retries. If a request at some level is fragmented into multiple requests, a trace event should indicate this and supply linkage data to allow the multiple requests to be tracked from that point. If multiple requests at some level are coalesced into a single request, a trace event should also indicate this and provide appropriate data to track the new request.
Use events to give visibility to resource consumption. Whenever resources are claimed, returned, created or deleted an event should record the fact. For example, claiming or returning buffers to a buffer pool or growing or shrinking the number of buffers in the pool.
The following guidelines can help you determine where and when you should have trace hooks in your code:
The intent of the trace format file is to provide rules for presentation and display of the expected data for each event ID. This allows new events to be formatted without changing the report facility. Rules for new events are simply added to the format file. The syntax of the rules provide flexibility in the presentation of the data.
Refer to the /etc/tcrfmt file to see examples of the syntax for stanzas that appear in the trace format file.
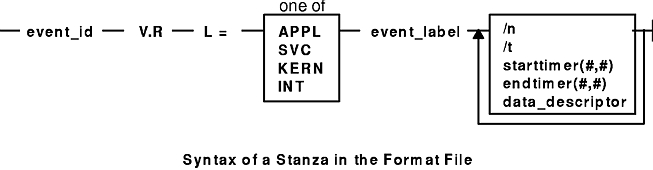
A trace format stanza can be as long as required to describe the rules for any particular event. The stanza can be continued to the next line by terminating the present line with a \ (backslash) character. The fields are:
| event_id | Each stanza begins with the three-digit hexadecimal event ID that the stanza describes, followed by a space. | ||||||||
| V.R | This field describes the version (V) and release (R) that the event was first assigned. Any integers work for V and R, and you may want to keep your own tracking mechanism. | ||||||||
| L= | The text description of an event can begin at various indentation levels. This improves the readability of the report output. The indentation levels correspond to the level at which the system is running. The recognized levels are:
| ||||||||
| event_label | The event_label is an ASCII text string that describes the overall use of the event ID. This is used by the -j option of the trcrpt command to provide a listing of events and their first level description. The event label also appears in the formatted output for the event unless the event_label field starts with an @ character. | ||||||||
| \n | The event stanza describes how to parse, label and present the data contained in an event record. You can insert a \n (newline) in the event stanza to continue data presentation of the data on a new line. This allows the presentation of the data for an event to be several lines long. | ||||||||
| \t | The \t (tab) function inserts a tab at the point it is encountered in parsing the description. This is similar to the way the \n function inserts new lines. Spacing can also be inserted by spaces in the data_label or match_label fields. | ||||||||
| starttimer(#,#) | The starttimer
and endtimer
fields work together. The (#,#) field is a unique identifier that associates a particular starttimer
value with an endtimer
that has the same identifier. By convention, if possible, the identifiers should be the ID of starting event and the ID of the ending event.
When the report facility encounters a start timer directive while parsing an event, it associates the starting events time with the unique identifier. When an end timer with the same identifier is encountered, the report facility outputs the delta time (this appears in brackets) that elapsed between the starting event and ending event. The begin and end system call events make use of this capability. On the return from system call event, a delta time is shown that indicates how long the system call took. | ||||||||
| endtimer(#,#) | See the starttimer field in the preceding paragraph. | ||||||||
| data_descriptor | The data_descriptor field is the fundamental field that describes how the report facility consumes, labels, and presents the data. The Syntax of the data_descriptor Field figure illustrates this field's syntax. | ||||||||
| data_label | The data label is an ASCII string that can optionally precede the output of data consumed by the following format field. | ||||||||
| format | Review the format of an event record depicted in the figure Format of a trace Event Record. You can think of the report facility as having a pointer into the data portion of an event. This data pointer is initialized to point to the beginning of the event data (the 16-bit data field in the hookword). The format
field describes how much data the report facility consumes from this point and how the data is considered. For example, a value of Bm.n tells the report facility to consume m bytes and n bits of data and to consider it as binary data.
The possible format fields are described in the following section. If this field is not followed by a comma, the report facility outputs the consumed data in the format specified. If this field is followed by a comma, it signifies that the data is not to be displayed but instead compared against the following match_vals field. The data descriptor associated with the matching match_val field is then applied to the remainder of the data. | ||||||||
| match_val | The match value is data of the same format described by the preceding format fields. Several match values typically follow a format field that is being matched. The successive match fields are separated by commas. The last match value is not followed by a comma. Use the character string \* as a pattern-matching character to match anything. A pattern-matching character is frequently used as the last element of the match_val field to specify default rules if the preceding match_val field did not occur. | ||||||||
| match_label | The match label is an ASCII string that is output for the corresponding match. |
Each of the possible format fields is described in the comments of the /etc/trcfmt file. The following shows several possibilities:
| Format field | descriptions |
| Am.n | This value specifies that m bytes of data are consumed as ASCII text, and that it is displayed in an output field that is n characters wide. The data pointer is moved m bytes. |
| S1, S2, S4 | Left justified string. The length of the field is defined as 1 byte (S1), 2 bytes (S2), or 4 bytes (S4). The data pointer is moved accordingly. |
| Bm.n | Binary data of m bytes and n bits. The data pointer is moved accordingly. |
| Xm | Hexadecimal data of m bytes. The data pointer is moved accordingly. |
| D2, D4 | Signed decimal format. Data length of 2 (D2) bytes or 4 (D4) bytes is consumed. |
| U2, U4 | Unsigned decimal format. Data length of 2 or 4 bytes is consumed. |
| F4, F8 | Floating point of 4 or 8 bytes. |
| Gm.n | Positions the data pointer. It specifies that the data pointer is positioned m bytes and n bits into the data. |
| Om.n | Skip or omit data. It omits m bytes and n bits. |
| Rm | Reverse the data pointer m bytes. |
Some macros are provided that can be used as format fields to quickly access data. For example:
| $D1, $D2, $D3, $D4, $D5 | These macros access data words 1 through 5 of the event record without moving the data pointer. The data accessed by a macro is hexadecimal by default. A macro can be cast to a different data type (X, D, U, B) by using a % character followed by the new format code. For example, the following macro causes data word one to be accessed, but to be considered as 2 bytes and 3 bits of binary data:
$D1%B2.3 |
| $HD | This macro accesses the first 16 bits of data contained in the hookword, in a similar manner as the $D1 through $D5 macros access the various data words. It is also considered as hexadecimal data, and also can be cast. |
You can define other macros and use other formatting techniques in the trace format file. This is shown in the following trace format file example.
# .
# .
# .
#
# I. General Information
#
# A. Binary format for the tracehook calls. (1 column = 4 bits)
#   trchk     MMmTDDDD
#   trchkt    MMmTDDDDtttttttt
#   trchkl    MMmTDDDD11111111
#   trchklt   MMmTDDDD11111111tttttttt
#   trchkg    MMmTDDDD1111111122222222333333334444444455555555
#   trchkg    MMmTDDDD1111111122222222333333334444444455555555tttttttt
#   trcgen    MMmTLLLL11111111vvvvvvvvvvvvvvvvvvvvvvvvvvxxxxxx
#   trcgent   MMmTLLLL11111111vvvvvvvvvvvvvvvvvvvvvvvvvvxxxxxxtttttttt
#
#        legend:
#   MM = major id
#   m  = minor id
#   T  = hooktype
#   D  = hookdata
#   t  = nanosecond timestamp
#   1  = d1 (see trchkid.h for calling syntax for the tracehook routines)
#   2  = d2, etc.
#   v  = trcgen variable length buffer
#   L  = length of variable length data in bytes.
#
#  The DATA_POINTER starts at the third byte in the event, ie.,
#    at the 16 bit hookdata DDDD.
#  The trcgen() type (6,7) is an exception.The DATA_POINTER starts at
#    the fifth byte, ie., at the 'd1' parameter 11111111.
#
# B. Indentation levels
#    the left margin is set per template using the 'L=XXXX' command.
#    The default is L=KERN, the second column.
#    L=APPL moves the left margin to the first  column.
#    L=SVC  moves the left margin to the second column.
#    L=KERN moves the left margin to the third  column.
#    L=INT  moves the left margin to the fourth column.
#    The command if used must go just after the version code.
#
#    Example usage:
#113 1.7 L=INT "stray interrupt" ... \
#
# C. Continuation code and delimiters.
#    A '\' at the end of the line must be used to continue the template
#      on the next line.
#    Individual strings (labels) can be separated by one or more blanks
#      or tabs. However, all whitespace is squeezed down to 1 blank on
#      the report. Use '\t' for skipping to the next tabstop, or use
#      A0.X format (see below) for variable space.
#
#
# II. FORMAT codes
#
# A. Codes that manipulate the DATA_PONTER
# Gm.n
#    "Goto"    Set DATA_POINTER to byte.bit location m.n
#
# Om.n
#    "Omit"    Advance DATA_POINTER by m.n byte.bits
#
# Rm
#    "Reverse" Decrement DATA_POINTER by m bytes. R0 byte aligns.
#
# B. Codes that cause data to be output.
# Am.n
#    Left justified ascii.
#    m=length in bytes of the binary data.
#    n=width of the displayed field.
#    The data pointer is rounded up to the next byte boundary.
#    Example
#     DATA_POINTER|
#                  V
#             xxxxxhello world\0xxxxxx
#
#  i.   A8.16 results in:                       |hello wo        |
#       DATA_POINTER--------|
#                           V
#             xxxxxhello world\0xxxxxx
#
#  ii.  A16.16 results in:                      |hello world     |
#       DATA_POINTER----------------|
#                                   V
#             xxxxxhello world\0xxxxxx
#
#  iii. A16 results in:                         |hello world|
#       DATA_POINTER----------------|
#                                   V
#             xxxxxhello world\0xxxxxx
#
#  iv.  A0.16 results in:                       |                |
#       DATA_POINTER|
#                   V
#             xxxxxhello world\0xxxxxx
#
# S1, S2, S4
# Left justified ascii string.
# The length of the string is in the first byte(half-word, word)
# of the data. This length of the string does not include this byte.
#  The data pointer is advanced by the length value.
#     Example
#      DATA_POINTER|
#                  V
#             xxxxxBhello worldxxxxxx     (B = hex 0x0b)
#
#  i.   S1 results in:                          |hello world|
#       DATA_POINTER-----------|
#                              V
#             xxxxBhello worldxxxxxx
#
# $reg%S1
#     A register with the format code of 'Sx' works "backwards"
#     from a register with a different type. The format is Sx,
#     but the length of the string comes from $reg instead of the
#     next n bytes.
#
# Bm.n
#     Binary format.
#     m = length in bytes
#     n = length in bits
#     The length in bits of the data is m * 8 + n. B2.3 and B0.19
#     are the same. Unlike the other printing FORMAT codes, the
#     DATA_POINTER can be bit aligned and is not rounded up to
#     the next byte boundary.
#
# Xm
#     Hex format.
#     m = length in bytes. m=0 thru 16
#     The DATA_POINTER is advanced by m.
#
# D2, D4
#     Signed decimal format.
#     The length of the data is 2 (4) bytes.
#     The DATA_POINTER is advanced by 2 (4).
#
# U2, U4
#     Unsigned decimal format.
#     The length of the data is 2 (4) bytes.
#     The DATA_POINTER is advanced by 2 (4).
#
# F4
#     Floating point format. (like %0.4E)
#     The length of the data is 4 bytes.
#     The format of the data is that of C type 'float'.
#     The DATA_POINTER is advanced by 4.
#
# F8
#     Floating point format. (like %0.4E)
#     The length of the data is 8 bytes.
#     The format of the data is that of C type 'double'.
#     The DATA_POINTER is advanced by 8.
#


# HB
#     Number of bytes in trcgen() variable length buffer.
#     This is also equal to the 16 bit hookdata.
#     The DATA_POINTER is not changed.
#
# HT
#  The hooktype. (0 - E)
#  trcgen  = 0, trchk  = 1, trchl  = 2, trchkg  = 6
#  trcgent = 8, trchkt = 9, trchlt = A, trchkgt = E
#  HT & 0x07 masks off the timestamp bit
#  This is used for allowing multiple, different trchkx() calls with
#       the same template.
#     The DATA_POINTER is not changed.
#
# C. Codes that interpret the data in some way before output.
# T4
#     Output the next 4 bytes as a data and time string,
#     in GMT timezone format.  (as in ctime(&seconds))
#     The DATA_POINTER is advanced by 4.
#
# E1,E2,E4
#     Output the next byte (half_word, word) as an 'errno' value,
#     replacing the numeric code with the corresponding #define name in
#     /usr/include/sys/errno.h
#     The DATA_POINTER is advanced by 1, 2, or 4.
#
# P4
#  Use the next word as a process id (pid), and output the
#  pathname of the executable with that process id.Process
#  ids and their pathnames are acquired by the trace command at
#  the start of a trace and by trcrpt via a special EXEC tracehook.
#  The DATA_POINTER is advanced by 4.
#
# \t
#  Output a tab. \t\t\t outputs 3 tabs. Tabs are expanded to spaces,
#  using a fixed tabstop separation of 8.If L=0 indentation is used,
#     the first tabstop is at 3.
#     The DATA_POINTER advances over the \t.
#
# \n
#  Output a newline. \n\n\n outputs 3 newlines.
#  The newline is left-justified according to the INDENTATION LEVEL.
#     The DATA_POINTER advances over the \n.
#
# $macro
#     The value of 'macro' is output as a %04X value. Undefined
#     macros have the value of 0000.
#     The DATA_POINTER is not changed.
#     An optional format can be used with macros:
#        $v1%X4    will output the value $v1 in X4 format.
#        $zz%B0.8  will output the value $v1 in 8 bits of binary.
#     Understood formats are: X, D, U, B. Others default to X2.
#
# "string"     'string' data type
#  Output the characters inside the double quotes exactly. A string
#     is treated as a descriptor. Use "" as a NULL string.
#


# `string format $macro` If a string is backquoted, it is expanded
#   as a quoted string, except that FORMAT codes and $registers are
#     expanded as registers.
#
# III. SWITCH statement
#     A format code followed by a comma is a SWITCH statement.
#     Each CASE entry of the SWITCH statement consists of
#       1. a 'matchvalue' with a type (usually numeric) corresponding
#          to the format code.
#       2. a simple 'string' or a new 'descriptor' bounded by braces.
#          A descriptor is a sequence of format codes, strings,
#          switches and loops.
#       3. and a comma delimiter.
#  The switch is terminated by a CASE entry without a comma
#  delimiter.   The CASE entry is selected to as the first
#  entry whose matchvalue   is equal to the expansion of the format
#  code. The special matchvalue '\*' is a wildcard and matches
#  anything.
#  The DATA_POINTER is advanced by the format code.
#
#
# IV. LOOP statement
#     The syntax of a 'loop' is
#     LOOP format_code { descriptor }
#     The descriptor is executed N times, where N is the numeric value
#     of the format code.The DATA_POINTER is advanced by the
#     format code plus whatever the descriptor does. Loops are used to
#     output binary buffers of data, so descriptor is
#     usually simply X1 or X0. Note that X0 is like X1 but does not
#     supply a space separator ' ' between each byte.
#
# V. macro assignment and expressions
#  'macros' are temporary (for the duration of that event) variables
#   that work like shell variables.
#   They are assigned a value with the syntax:
#   {{ $xxx = EXPR }}
#   where EXPR is a combination of format codes, macros, and constants.
#   Allowed operators are + - / *
#   For example:
#{{ $dog = 7 + 6 }} {{ $cat = $dog * 2 }} $dog $cat
#
#   will output:
#000D 001A
#
#   Macros are useful in loops where the loop count is not always
#   just before the data:
#G1.5 {{ $count = B0.5 }} G11 LOOP $count {X0}
#
#   Up to 25 macros can be defined per template.
#
#
# VI. Special macros:
# $RELLINENO   line number for this event. The first line starts at 1.
# $D1 - $D5    dataword 1 through dataword 5. No change to datapointer.
# $HD          hookdata (lower 16 bits)
# $SVC         Output the name of the current SVC
# $EXECPATH    Output the pathname of the executable for current process.
# $PID         Output the current process id.
# $ERROR       Output an error message to the report and exit from the
               template after the current descriptor is processed.
#              The error message supplies the logfile, logfile offset of
#              the start of that event, and the traceid.
# $LOGIDX      Current logfile offset into this event.
# $LOGIDX0     Like $LOGIDX, but is the start of the event.
# $LOGFILE     Name of the logfile being processed.
# $TRACEID     Traceid of this event.
# $DEFAULT     Use the DEFAULT template 008
# $STOP        End the trace report right away
# $BREAK       End the current trace event
# $SKIP        Like break, but don't print anything out.
# $DATAPOINTER The DATA_POINTER. It can be set and manipulated
#              like other user-macros.
#              {{ $DATAPOINTER = 5 }} is equivalent to G5
# $BASEPOINTER Usually 0. It is the starting offset into an event.The
#              actual offset is the DATA_POINTER + BASE_POINTER. It is used
#              with template subroutines, where the parts on an event have
#              the same structure, and can be printed by the same template,
#              but may have different starting points into an event.
#
# VII. Template subroutines
#   If a macro name consists of 3 hex digits, it is a "template
#   subroutine". The template whose traceid equals the macro name
#   is inserted in place of the macro.
#
#   The data pointer is where is was when the template
#   substitution was encountered.Any change made to the data pointer
#   by the template subroutine remains in affect when the template
#   ends.
#
#   Macros used within the template subroutine correspond to those
#   in the calling template. The first definition of a macro in the
#   called template is the same variable as the first in the called.
#   The names are not related.
#
#   Example:
#   Output the trace label ESDI STRATEGY.
#   The macro '$stat' is set to bytes 2 and 3 of the trace event.
#   Then call template 90F to interpret a buf header. The macro
#   '$return' corresponds to the macro '$rv', since they were
#   declared in the same order. A macro definition with
#   no '=' assignment just declares the name
#   like a place holder. When the template returns,the saved special
#   status word is output and the returned minor device number.
#
#900 1.0 "ESDI STRATEGY" {{ $rv = 0 }} {{ $stat = X2 }} \
#    $90F \n\
#special_esdi_status=$stat for minor device $rv
#
#90F 1.0 "" G4 {{ $return }} \
#       block number X4 \n\
#       byte count   X4 \n\
#       B0.1, 1 B_FLAG0 \
#       B0.1, 1 B_FLAG1 \
#       B0.1, 1 B_FLAG2 \
#       G16 {{ $return = X2 }}
#
#  Note: The $DEFAULT reserved macro is the same as $008

#
# VII. BITFLAGS statement
#     The syntax of a 'bitflags' is
#     BITFLAGS [format_code|register],
#          flag_value string {optional string if false},   or
#          '&' mask field_value string,
#                   ...
#
#     This statement simplifies expanding state flags, since it look
#       a lot like a series of #defines.
#     The '&' mask is used for interpreting bit fields.
#     The mask is anded to the register and the result is compared to
#       the field_value. If a match, the string is printed.
#     The base is 16 for flag_values and masks.
#     The DATA_POINTER is advanced if a format code is used.
#     Note:the default base for BITFLAGS is 16. If the mask or field
#       value has a leading 0, the number is octal. 0x or 0X makes the
#       number hex.
# A 000 traceid will use this template
# This id is also used to define most of the template functions.
#  filemode(omode) expand omode the way  ls -l does. The
#                  call to setdelim() inhibits spaces between the chars.
#
There are five basic steps involved in generating a trace from your software program.
Enable and disable the trace from your software that has the trace hooks defined. The following code shows the use of trace events to time the running of a program loop.
#include      <sys/trcctl.h>
#include      <sys/trcmacros.h>
#include      <sys/trchkid.h>

char      *ctl_file = "/dev/systrctl";
int      ctlfd;
int      i;

main()
{
        printf("configuring trace collection \n");
        if (trcstart("-ad")){
                perror("trcstart");
                exit(1);
        }
        if((ctlfd = open(ctl_file,0))<0){
                perror(ctl_file);
                exit(1);
        }
        printf("turning  trace on \n");
        if(ioctl(ctlfd,TRCON,0)){
                perror("TRCON");
                exit(1);
        }
        /* here is the code that is being traced */
        for(i=1;i<11;i++){
                TRCHKL1T(HKWD_USER1,i);
                /*   sleep(1) */
                /* you can uncomment sleep to make the loop
                /* take longer. If you do, you will want to
                /* filter the output or you will be */
                /* overwhelmed with 11 seconds of data */
        }
        /* stop tracing code */
        printf("turning trace off\n");
        if(ioctl(ctlfd,TRCSTOP,0)){
                perror("TRCOFF");
                exit(1);
        }
        exit(0);
}
When you compile the sample program, you need to link to the librts.a library:
cc -o sample sample.c -l rts
Run the program. In this case, it can be done with the following command:
./sample
You must have root privilege if you use the default file to collect the trace information (/usr/adm/ras/trcfile).
This provides the report generator with the information to correctly format your file. The report facility does not know how to format the HKWD_USER1 event, unless you provide rules in the trace format file.
The following is an example of a stanza for the HKWD_USER1 event. The HKWD_USER1 event is event ID 010 hexadecimal. You can verify this by looking at the sys/trchkid.h header file.
# User event HKWD_USER1 Formatting Rules Stanza
# An example that will format the event usage of the sample program
010 1.0 L=APPL "USER EVENT - HKWD_USER1" O2.0 \n\
               "The # of loop iterations =" U4\n\
               "The elapsed time of the last loop = "\
                endtimer(0x010,0x010) starttimer(0x010,0x010)
Note: When entering the example stanza, do not modify the master format file /etc/trcfmt. Instead, make a copy and keep it in your own directory. This allows you to always have the original trace format file available.
Filter the output report to get only your events. To do this, run the trcrpt command:
trcrpt -d 010 -t mytrcfmt -O exec=on -o sample.rpt
The formatted trace results are:
ID PROC NAME  I   ELAPSED_SEC  DELTA_MSEC    APPL     SYSCALL    KERNEL   INTERRUPT
010   sample     0.000105984  0.105984     USER HOOK 1
                                           The data field for the user hook = 1
010   sample     0.000113920  0.007936     USER HOOK 1
                                           The data field for the user hook = 2 [7 usec]
010   sample     0.000119296  0.005376     USER HOOK 1
                                           The data field for the user hook = 3 [5 usec]
010   sample     0.000124672  0.005376     USER HOOK 1
                                           The data field for the user hook = 4 [5 usec]
010   sample     0.000129792  0.005120     USER HOOK 1
                                           The data field for the user hook = 5 [5 usec]
010   sample     0.000135168  0.005376     USER HOOK 1
                                           The data field for the user hook = 6 [5 usec]
010   sample     0.000140288  0.005120     USER HOOK 1
                                           The data field for the user hook = 7 [5 usec]
010   sample     0.000145408  0.005120     USER HOOK 1
                                           The data field for the user hook = 8 [5 usec]
010   sample     0.000151040  0.005632     USER HOOK 1
                                           The data field for the user hook = 9 [5 usec]
010   sample     0.000156160  0.005120     USER HOOK 1
                                           The data field for the user hook = 10 [5 usec]
The following sections provide some examples and suggestions for use of the trace facility.
Include several optional columns of data in the trace output. This causes the output to exceed 80 columns. It is best to view the reports on an output device that supports 132 columns.
Trace data accumulates rapidly. Bracket the data collection as closely around the area of interest as possible. One technique for doing this is to issue several commands on the same command line. For example, the command:
trace -a; cp /etc/trcfmt /tmp/junk; trcstop
captures the total execution of the copy command.
Note: This example is more educational if the source file is not already cached in system memory. The trcfmt file can be in memory if you have been modifying it or producing trace reports. In that case, choose as the source file some other file that is 50 to 100KB and has not been touched.
The trace facility displays system activity. It is a useful learning tool to observe how the system actually performs. The previous output is an interesting example to browse. To produce a report of the copy, use the following:
trcrpt -O "exec=on,pid=on" > cp.rpt
In the cp.rpt file you can see the following activities:
The trace output looks a little overwhelming at first. This is a good example to use as a learning aid. If you can discern the activities described, you are well on your way to being able to use the trace facility to diagnose system performance problems.
The full detail of the trace data may not be required. You can choose specific events of interest to be shown. For example, it is sometimes useful to find the number of times a certain event occurred. Answer the question, "how many opens occurred in the copy example?" First, find the event ID for the open subroutine:
trcrpt -j | pg
You can see that event ID 15b is the open event. Now, process the data from the copy example (the data is probably still in the log file) as follows:
trcrpt -d 15b -O "exec=on"
The report is written to standard output and you can determine the number of opens that occurred. If you want to see only the opens that were performed by the cp process, run the report command again using:
trcrpt -d 15b -p cp -O "exec=on"
This command shows only the opens performed by the cp process.
Combining multiple trace hooks into a trace hook group allows all hooks to be turned on at once when starting a trace.
The first item on the Start Trace menu is EVENT GROUPS to trace. The groups that can be traced are defined in the SWservAt ODM object class. Each group uses the Name_trcgrpdesc and Name_trcgrp attributes. Name is the name of the trace group that must be no longer than 8 characters. The _trcgrpdesc attribute specifies the group description, and the _trcgrp attribute specifies the trace hooks in the group. A group can have only one _trcgrpdesc description, but it can have multiple _trcgrp hook lists.
The following example shows the definition of the general kernel activity (gka) trace group.
SWservAt:
       attribute = "gka_trcgrpdesc"
       value = "GENERAL KERNEL ACTIVITY (files,execs,dispatches)"

SWservAt:
       attribute = "gka_trcgrp"
       value = "106,134,139,107,135,15b,12e"
Note that the value of gka_trcgrpdesc is shown by SMIT as the description of the group. The value list for gka_trcgrp contains the hooks in the group. You can add another gka_trcgrp attribute to add additional trace hooks to that group. The hook ids must be enclosed in double quotes (") and separated by commas.