[ Previous | Next | Contents | Home | Search ]
AIX Versions 3.2 and 4 Asynchronous Communications Guide

Monitoring the 128-Port Asynchronous Subsystem (AIX Version 4.1 Systems or Later)

The mon-cxma program provides the following capabilities:

Prerequisite Information

Running the Monitor from SMIT

Use the following procedure to execute the mon-cxma program from SMIT.

Procedure

  1. Use the smit ttyadapters fast path to access the 128-Port Asynchronous Adapter menu.
  2. Select Monitor Async Adapters.
  3. Select the appropriate 128-port asynchronous adapter from the SMIT panel. In this example, three asynchronous adapters are installed in the system; one of which is located on a different bus.
  4. For this example, select Bus 0, Slot 2 Asynchronous adapter. This selection takes you to the ACTIVE CONFIGURATION screen.
  5. The ACTIVE CONFIGURATION screen is used as the main panel for the monitor program and displays the following 128-port subsystem information: You can also view Vital Product Data (VPD) and adapter status from this panel by pressing the appropriate function key (F6 or F7). A screen image can be saved to the monitor log file, /tmp/mon-cxma.log, by pressing the F8 (Image) key.

    Vital Product Data (VPD) is a collection of device information such as part numbers, serial numbers, and engineering change levels. This information is used by service personnel to determine compatibility of hardware components. The data is collected from the 128-port asynchronous subsystem and automatically added to the system configuration. Service representatives may find it necessary to view this information before making upgrade or replacement decisions concerning the 128-port subsystem.

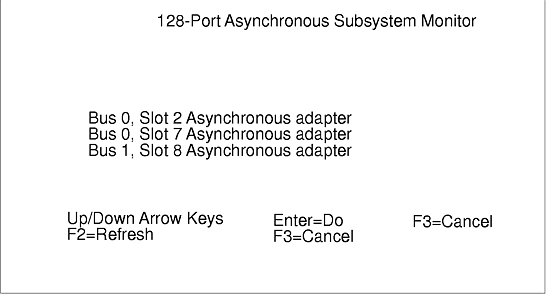
    The following figure illustrates the main panel for the monitor program.

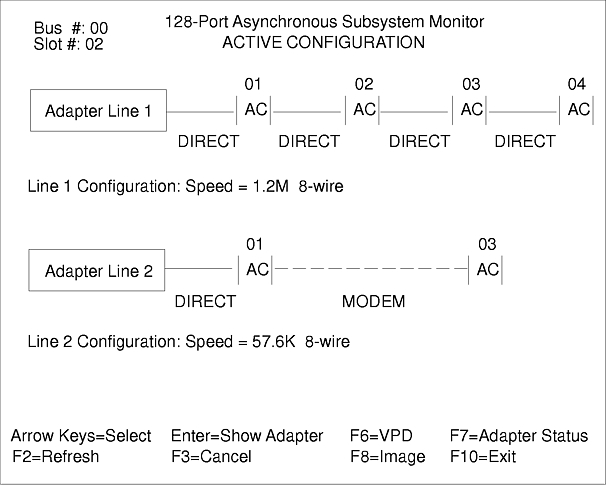
    On this screen, RANs are represented by [AC] if active, or (-) if inactive (turned off, defective). In this example, Adapter Line 1 has four directly attached RANs which are daisy-chained directly off the 128-port adapter. They are all active and assigned node numbers sequentially from 01 to 04 .

    Adapter Line 2 has two RANs attached. The first RAN, node 01 , is directly attached to the 128-port adapter while the second, node 03 , is connected to the first using EIA 232 modems.

    You can move between the Adapter Lines or RANs by using the up and down arrow keys. If you press Enter on an Adapter Line, the ADAPTER CONFIGURATION screen for that adapter is displayed.

    The ADAPTER CONFIGURATION screen shows the adapter's line configuration as well as the configuration string stored in memory during system startup. This string is used during initialization to determine line speeds and connection types between the 128-port adapter and RAN. It is useful for diagnosing configuration problems.

  6. To view a port's activity, use the arrow keys to select the desired, active RAN (represented by [AC]) and press the Enter key. The software displays a graphic representation of the RAN front panel as shown in the figure below:

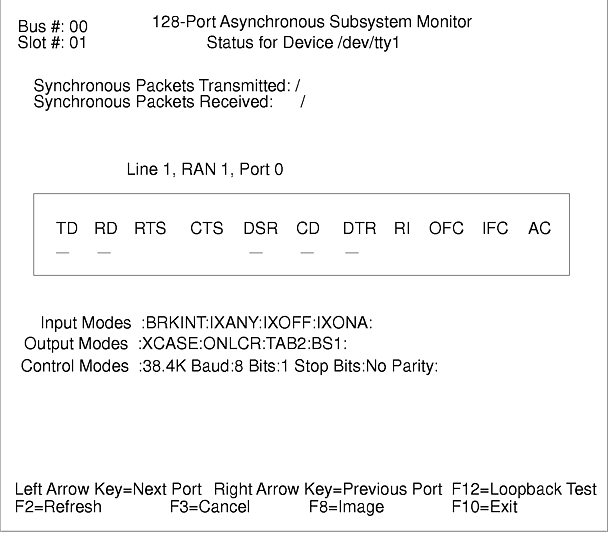
    This screen is updated at half second intervals and shows the current status of the selected port.

    The box in the center of the screen shows the state of the EIA 232 signals TD, RD, CTS, DSR, CD, DTR, and RI, plus input and output flow control status (IFC and OFC) for the selected port.

    An inactive signal is indicated by a dash (-) under its name. An active signal is indicated by a block under its name. If data is currently being transmitted or received for the selected port, a blinking "X" will appear under the signal name (TD or RD, respectively).

    The status of the RAN is represented at the right-hand end of the box with [AC] if the connection to the host adapter is good.

    Beneath the line status box are the input, output and control modes for that port. These are terminal attributes with descriptions.

    INPUT MODES
    IGNBRK Ignore Break.
    BRKINT Interrupt on Break.
    IGNPAR Ignore parity errors.
    PARMRK Mark parity errors.
    INPCK Input parity check.
    ISTRIP Strip input characters.
    ITOSS Toss IXANY characters.
    IXON Enable start/stop output.
    IXANY Restart output on any character.
    IXOFF Enable start/stop input.
    IXONA Enable start/stop output Auxiliary.
    OUTPUT MODES
    XCASE Canonical upper/lower display.
    OLCUC Map lower case to upper.
    ONCLR Map NL to CR/NL.
    OCRNL Map CR to NL.
    ONOCR No CR output at column 0.
    ONLRET NL performs CR function.
    OFILL Use fill characters for delay.
    OFDEL Fill character id DEL; otherwise NUL.
    NLDLY NL delay is selected.
    CR1 Carriage Return delay type 1.
    CR2 Carriage Return delay type 2.
    CR3 Carriage Return delay type 3.
    TAB1 Tab delay type 1.
    TAB2 Tab delay type 2.
    TAB3 Tab delay type 3.
    BS1 Backspace delay.
    VT1 Vertical tab delay.
    FF1 Form feed delay.
    CONTROL MODES
    Baud Rate 50,75,110,134,150,200,300,600,1200,1800,2400,4800,9600,9200,38400.

    If fastbaud is enabled, baud rates of 50, 75, 110, and 200 are translated to 57600, 75600, 115200, and 230000, respectively.

    Char Bits 5, 6, 7, 8 or none.
    Stop Bits 2, 1 or none.
    Parity Enabled, odd or none.
    fastbaud Fast baud rates.

    To examine the fastbaud setting, use the command:

    /usr/lbin/tty/stty-cxma -a tty1

    Fastbaud is disabled if it is preceded by a minus sign. To enable fastbaud, use the command:

    /usr/lbin/tty/stty-cxma fastbaud tty1

    The baud rate of the tty device must be 50, 75, 110, or 200 for fastbaud to take effect.

    Up-arrow Increment RAN number. If the currently selected RAN is the last one on the synchronous line, then the number wraps around to first RAN.
    Down-arrow Decrement RAN number. If the currently selected RAN is the first one on the synchronous line, then the number wraps around to the last RAN on the line.
    Right-arrow,l Increment port number. If the currently selected port is the last one on the RAN, then the port number wraps around to the first port.
    Left-arrow,h Decrement port number. If the currently selected port is #1, then the port number wraps around to the last port on the RAN.
    0-9, a-f Fastpath port selection. Press 0-9 for ports 0-9, respectively, and a-f for ports 10-15, respectively.
    F12 Run loop back test on the selected port. The loop back test transmits 128 bytes and attempts to read them back through the same port. A loop back plug is required.
    F8 Dumps the current screen contents to the log file. The default log filename is /tmp/dpalog. A different file may be specified by using the -l LogFile command line option. Refer to the mon-cxma command for a description. If the Print key does not map correctly, use ^P (Ctrl-P) instead.
    F3 Return to the previous screen.
    F10 Quit the monitor program.
  7. To run a loop back diagnostic test from the Status for Device screen, press the F12 key. A loop back plug (IBM part number 43G0928) must be installed in the port to be tested. The loop back test consists of five phases:
    PHASE 1 Verify that the port is not currently in use. All signals must be low. If a port is busy, a message similar to the following is displayed:
    Port is Busy  :DTR:CD:DSR:RTS
    PHASE 2 128 bytes of test data (the letter A is used) are put into the transmit buffer. If the write operation fails, a message similar to the following is displayed:
    Loop Back Test Failure #1

    After the write operation is complete, the FEP/OS is notified that data is available for transmission. At this time, the 128 bytes of data is transmitted. If the transmission fails, the following message is displayed:

    Loop Back Test Failure #2
    PHASE 3 At this point, the subsystem should have received 128 bytes of data. If not, the following message is displayed:
    Loop Back Test Failure #3
    Data Not Transferred to RX.
    PHASE 4 128 bytes of data are read from the receive buffer. If the read operation fails, the following message is displayed:
    Loop Back Test Failure #4
    PHASE 5 The data that was transmitted is compared with the data that has been read from the receive buffer. If the comparison fails, the following message is displayed:
    Loop Back Test Failure #5
    If all test phases pass, the following message is displayed:
    Loop Back Test Passed.
  8. Press the F3 key to return to the Status for Device screen after the test is completed.
  9. You can then press the F3 key to return to the ACTIVE CONFIGURATION screen and continue in the monitoring program or exit the SMIT interface.

[ Previous | Next | Contents | Home | Search ]