- A visualized tolerance analysis displays assembly deformations or initial deformations of any assembly's component according to the selected activity.
- You can only visualize computed activities.
- See Computing Tolerance Analysis.
-
Compute the Release.2 activity. See Computing Tolerance Analysis.
-
The Visualization dialog box appears. 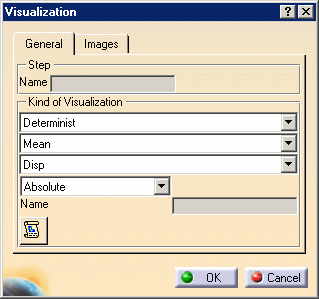
- Clicking the Report button in the visualization dialog box generates a html file containing the compute report.
- In the Kind of Visualization
frame you can define the desired visualization:
- Determinist
- Mean
- Normal display or Residual Stress
- Statistics
- Mean or Mean minus three standard deviations or Mean plus three standard deviations
- Normal display or Residual Stress
- Determinist
- Three delta analyses are available:
- Absolute
- Product Delta
- Activity Delta
-
Select View -> Render Style -> Customize View.
The Custom View Modes dialog box appears. 
-
Select the options as displayed in the Custom View Modes dialog box and click OK.
-
Click the Visualization icon:

-
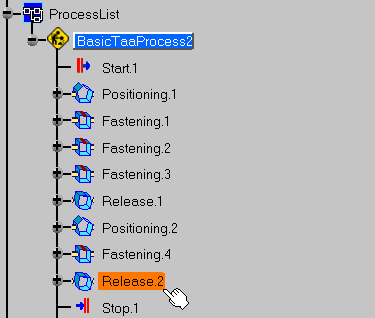
Click on the Release.2 activity in the process list to visualize it.
The assembly looks like this: Assembly components after computation appear with their deformations. 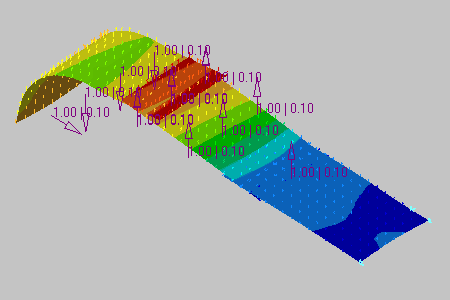
The Translational displacement magnitude tool displays the deformations scale. 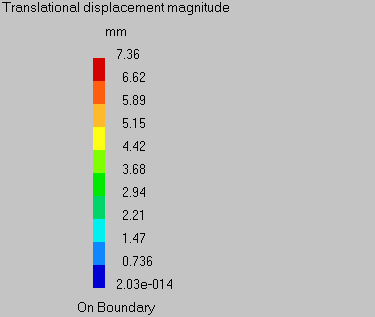
-
Click on Plate One to visualize its input tolerances.
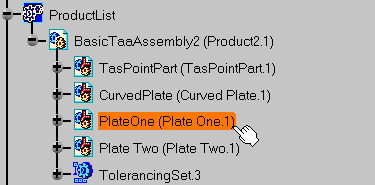
Input tolerances are visualized. 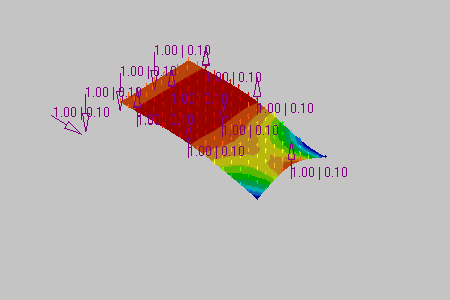
-
Click on Release.2 activity to visualize it again.


-
Select Residual Stress.
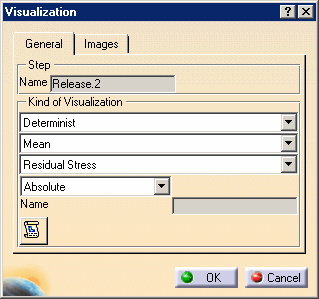
Residual Stresses are displayed in the assembly. 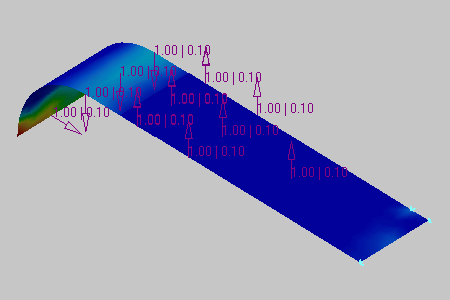
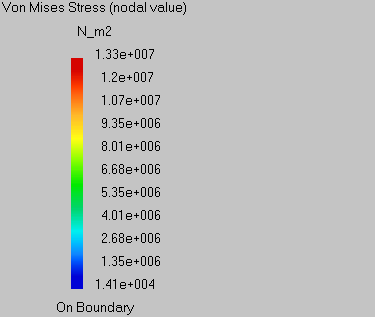
The Von Mises Stress tool displays the deformations scale. 