 |
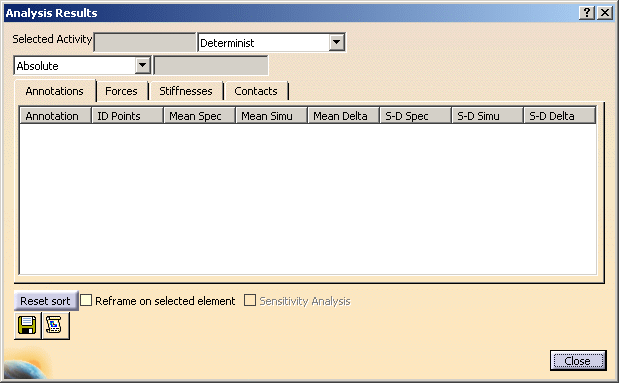
In this dialog box are displayed assembly deformations or initial deformations of any assembly component according to the selected activity:
- Output Annotations
- Reaction Forces
- Perceived Stiffnesses at Fastening Locations
- Contacts
- Miscellaneous Commands
Output Annotations
Output annotations are assigned to the selected activity through annotation bags or annotation captures. These annotations must be defined under the parent component of the assembly. For a specified activity, you can perform four different analyses for output annotations:
Determinist Analysis
For each output annotation related with the selected activity, are displayed:
- Annotation: the output annotation names.
- ID Points: the points associated with.
- Mean Spec: the specified means.
- Mean Simu: the simulated means.
- Mean Delta: the differences between the simulated means and the specified means.
 |
Statistics Analysis
For each output annotation related with the selected activity, are displayed:
- Annotation: the output annotation names.
- ID Points: the points associated with.
- Mean Spec: the specified means.
- Mean Simu: the simulated means.
- Mean Delta: the differences between the simulated means and the specified means.
- S-D Spec: the specified standard deviations.
- S-D Simu: the simulated standard deviations.
- S-D Delta: the differences between the simulated standard deviations and the specified standard deviations.
 |
Sensitivity Analysis
The percentage value can only be displayed close to the 3D representation of input annotations, therefore, any annotation without 3D representation will not have its sensitivity displayed.
Statistics All Direction Analysis
For each output annotation related with the selected activity, are displayed:
- Annotation: the output annotation names.
- ID Points: the points associated with.
- Mean X: the means according to the X direction.
- Mean Y: the means according to the Y direction.
- Mean Z: the means according to the Z direction.
- S-D X: the standard deviations according to the X direction.
- S-D Y: the standard deviations according to the Y direction.
- S-D Z: the standard deviations according to the Z direction.
 |
Worst Case Analysis
For each output annotation related with the selected activity, are displayed:
- Annotation: the annotation names.
- ID Points: the points associated with.
- IT Spec: the specified interval of tolerance.
- IT Simu: the simulated interval of tolerance.
- IT Delta: the difference between the simulated interval of tolerance and the specified interval of tolerance.
- Max: the maximal value.
- Min: the minimal value.
 |
Non-valuated Output Annotation
 |
Reaction Forces
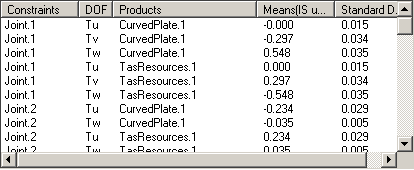
For each mechanical joint related with the selected activity, are displayed:
- Constraints: the mechanical joint's name.
- DOF: its degree of freedom for a specified constrained direction.
- Products: its related component.
- Mean (IS unit): its mean.
- Standards Deviations (IS unit): its standard deviation.
 |
Perceived
Stiffnesses at Fastening Locations
The analysis provides with the following options:
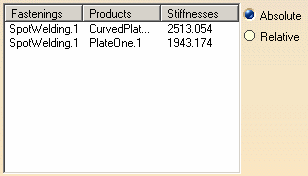
- Absolute: the stiffness perceived by the tooling for each component to be fastened and independently for each fastening location.
For each fastening assigned to the selected fastening activity, are displayed:
- Fastenings: the fastening names.
- Products: their related components.
- Stiffnesses: their stiffnesses.
 |
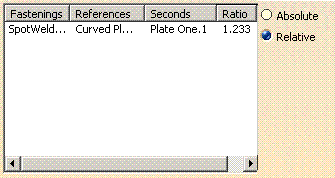
- Relative: the ratio of the perceived stiffness for the two components to be fastened.
For each fastening assigned to the selected fastening activity, are displayed:
- Fastenings: the fastening names.
- References: first component(s) corresponds to numerator N
- Seconds: second component(s) corresponds to denominator D
- Ratio: K "relative" = N/D
 |
Contacts
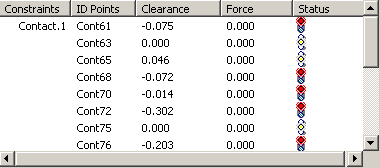
Once an activity has been computed, a determinist analysis is available for contacts, giving the clearance and reaction forces on each points of the contact.
A contact point is valid, if either the clearance is positive (gap) or
the contact force is negative (compression).
A contact point is invalid, if either the clearance is negative
(interference) or if the contact force is positive (traction).
If a traction or an interference are low, you may want to neglect some invalid contact points: this is possible through the Contact Management Threshold.
The analysis is performed on contacts whether or not the contacts have been assigned to activities.
A contact cannot have a non-null clearance (passive mode, not assigned) and a non-null reaction force (active mode, assigned) at the same time.
This analysis is performed in Determinist mode only, with an Absolute reference.
For each contact are displayed:
- Constraints: the name of the contact,
- ID Points: the name of the contact points within a contact,
- Clearance: a negative clearance means there is an interference. The contact point is invalid.
- Force:
- a positive force means there is a traction. The contact point is invalid.
- a null force usually means the contact is not assigned to the activity.
- Status:
- The green light mean the contact point is valid.
- The red light means the contact point is invalid.
- The orange light means the contact point is neglected.
 |
When invalid contacts are found, you must:
- assign contacts that detect an interference,
- unassign contacts that have a traction force,
- re-compute the activity and visualize the analysis results,
- repeat the steps above until all contacts are valid.