|
-
Click Deviation Report
 in the Check Deviation toolbar.
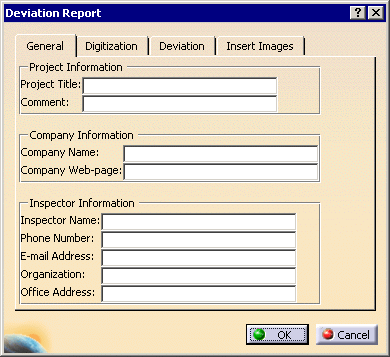
The Deviation Report dialog box is displayed:
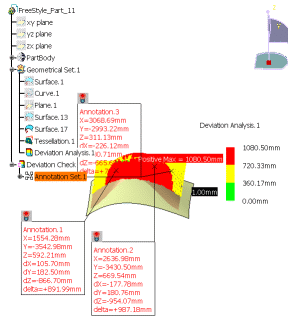
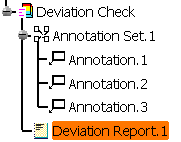
If it does not yet exist, a Deviation Check node is created in
the specification tree. A node Deviation Report.1 is added
under Deviation Check.
-
Fill in the fields in proposed in the dialog box.
Click OK when you are done.
A Deviation Report feature is created in the specification
tree.
-
Use the Deviation Report contextual menu
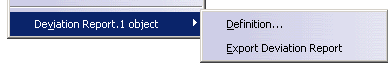
to edit it (Definition) or export it to a html file.
The html file looks like this:
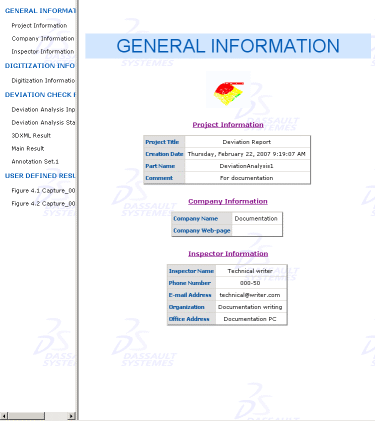
Use the hyperlinks on the sections on the left to navigate through it.
Contents of the Deviation Report
You will find hereafter captures of the Deviation Report
dialog box tabs and examples of how the Deviation Report sections
look like once the report has been exported to a html file.
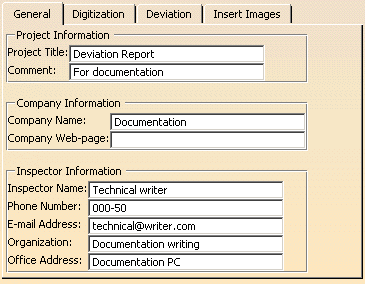
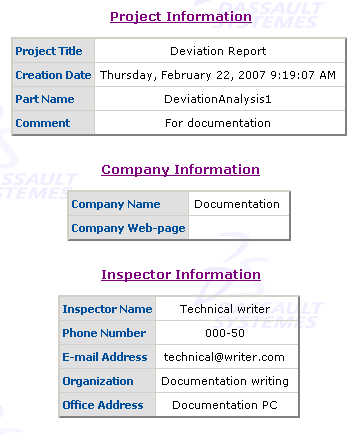
General:
These data are specific to the project, company and inspector.
In the dialog box:
In the html file:
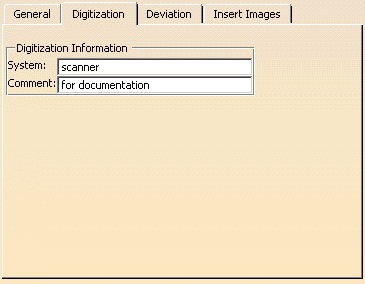
Digitization:
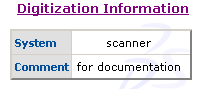
These data are specific to the digitization system used.
In the dialog box:
In the html file:
Deviation:
This tab lets you define which information about the deviation analysis you
want to insert in the deviation report.
In the dialog box:
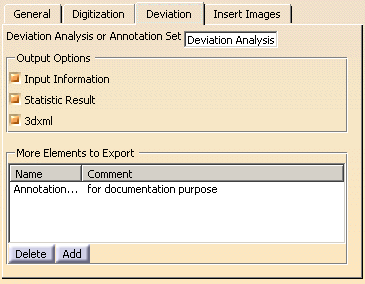
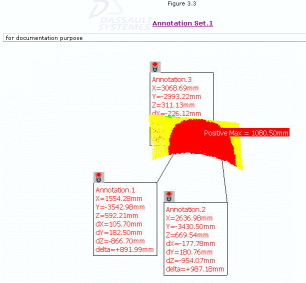
- Select a Deviation Analysis or an annotation set.
This will be the main element of the report and if required, it
will be exported in 3dxml. Its name is displayed
in the dialog box.
Place your cursor in the field to replace your selection by
another one.
- Output Options:
These three check boxes are selected by default.
Clear the ones you do not require.
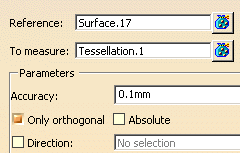
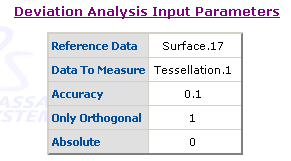
Input Information: information on the input of
the deviation analysis and its parameters.
In the Deviation Analysis dialog box:
In the hmtl file:
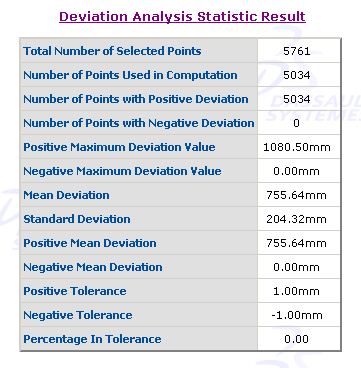
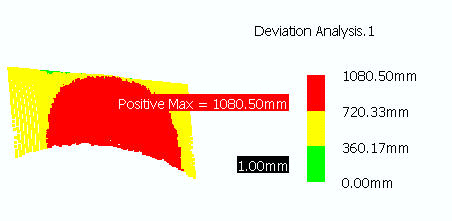
Statistic Result: statistics and color map
of the deviation analysis.
and
3dxml: exports the 3dxml result.
- More Elements to Export:
Lets you export additional geometrical feature:
Click
Add and select the required feature.
Its name is displayed in the dialog box.
Click under Comment in the line of the feature and key in any
necessary comment.
Select a feature in the dialog box and click
Delete to
delete it.
In the html file:
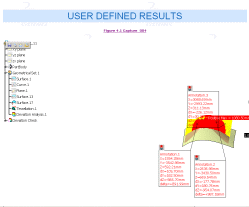
- Insert Images:
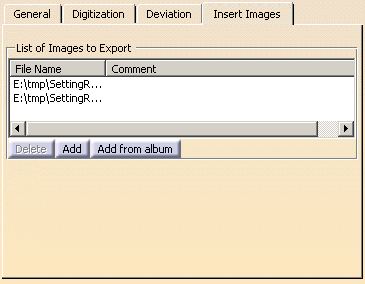
Lets you insert images in the report.
They can be created with the Tools > Images > Capture
menu or by any other means.
Allowed format are .bmp, .gif, .jpeg, .jpg, .png
Click
Add and select the image you want to insert from
your directories.
Click Add from album to insert all the images in the
allowed formats found in the album.
In the html file, they appear under USER DEFINED RESULTS (we have shown
only one of the images):
|