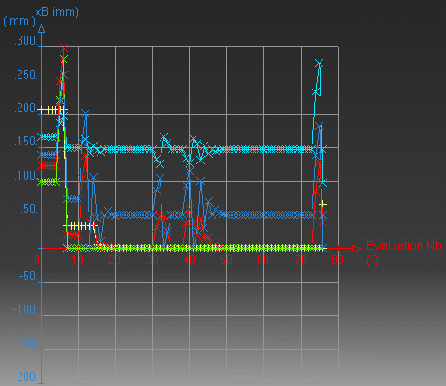
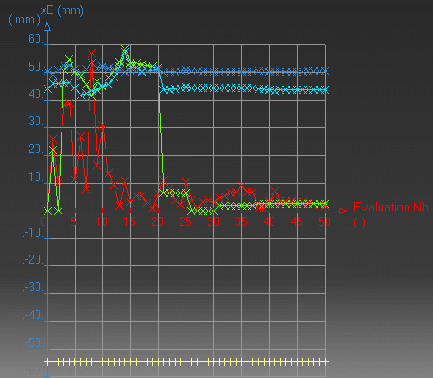
If you want to study the computation results after an optimization has been carried out, check the Save Optimization Data box. If need be, modify the default path. The file generated contains (for each iteration), the value of the objective function as well as the free parameter values (and the constraints values if any.)
The optimization curves are generated from the data provided by this result file.
Click Show Curves... to display the optimization curves. The abscissa represents the iteration numbers and the ordinate represents the objective function value, or the free parameter values. You must click the relevant curve key displayed on the right of the curves to obtain the proper values on the ordinate axis.
The optimization curves are generated from the result file. To display the optimization curves, you must have checked the Save optimization data box.
As far as the evolution of the "Optimized Parameter" is concerned, 2 curves are drawn:
|
|
The curves below are the result of the optimization carried out in the Getting Started section of this Guide.
 |
Gradient Algorithm |
 |
Simulated Annealing Algorithm |
The optimization process may issue several warnings. One of the most common is the "Unable to restore best solution" warning.
The openness of PEO enables you to insert any kind of objective functions. Some of them might be either non deterministic or dependent on previous actions (case of a model with rules impacting the result of the objective function.)
The consequence for optimization is the disability to restore a previously found configuration. A warning is issued specifying the difference between the restored solution and the previously best configuration. A small difference is usually due to rounding errors: In this case the optimization is valid. Accept the results. A large difference might indicate that there is a real problem.
Causes of errors
| Problems | Solutions | ||
Models with rules that impact the objective function
definition during the optimization process.
During the optimization process if x takes a value between 1 and 2, the definition of the problem changes. |
Check the model. | ||
| Models with sketches that can take unreasonable
configurations from which they cannot escape.
|
Always use constraint sketches and use ranges in the
optimization.
|
||
| Analysis models with adapted types of meshing elements that are not adapted (T4 instead of T10.) | Use polynomenial interpolation (T10) instead of linear (T4). |