This task shows you how to edit the 2D Display parameters.
You can edit:
- x axis parameters (limits, scale, ...)
- y axis parameters (limits, scale, ...)
- plot parameters (color, thickness of the line, ...)
- legend parameters (position, text style, ...)
- display parameters (background color, units, ...)
- graph parameters (cursor, legend, ...)
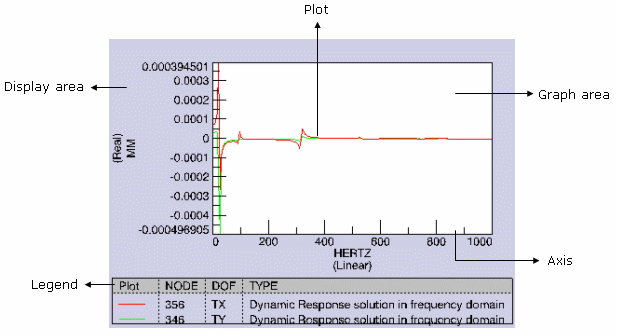
The following diagram gives you the main parts of a 2D Display document.
To perform this task, you have to:
- open the sample58.CATAnalysis document from the samples directory.
- generate a 2D display result with only one graph for a dynamic
response computation.
For more details, refer to Generating 2D Display for Dynamic Response.
In this task, you will work with the following graph:
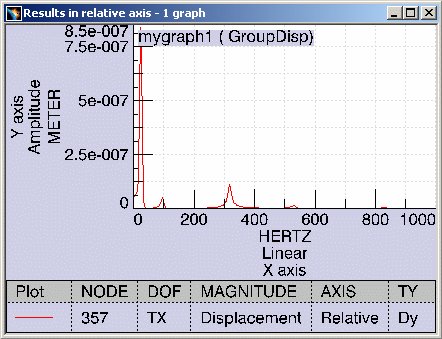
Editing X Axis Parameters
You will see here how to edit the x axis system parameters.
-
Right-click the X axis system.
The following contextual menus are available:

- Limits: lets you choose
between the following options:
- Free
- Optimized
- Fixed...: lets you fix the limit of the X axis by entering Lower and Upper values.
- Application Defined
- Format:
- Linear: lets you select a linear scale
- Octaves: lets you choose a scale with logarithm in base 2
- Decades: lets you choose a scale with logarithm in base 10
- Power2: lets you choose a scale with logarithm in base 2 and the annotation in real powers of 2
- Options...: lets you access the X Axis dialog box.
You can also double-click the X Axis to access the X Axis dialog box.
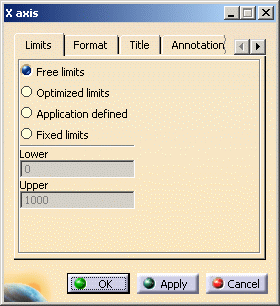
- Limits: for more details, click here.
- Format: for more details, click here.
- Annotation:
- Include limit annotation: lets you hide or show the limit values of the axis.
- Include tick annotation: lets you hide or show the tick values.
- Include units: lets you hide or show the unit values.
- Include format: lets you hide or show the selected scale format.
- Include title: lets you hide or show the axis title.
- Setting for Linear Formats
- Number of divisions: Automatic, One, Two, Four, Five, Ten
- Resolution: Automatic, One, Two, Four, Five, Ten
- Title: lets you modify the
name of the axis.
- Default: lets you preserve the default axis name (X axis).
- Custom: lets you enter a new axis name.
This will modify the name of the dialog box.
- Grid: lets you modify the
Color, the Dash Style and the Weight of
the grid.
- Show on major ticks
- Show on minor ticks
- Text Style: lets you change
the style of the x axis text.
- Inherit
- Customized: lets you customize the text style of the X axis. You can choose the Size and the Font of the X axis text.
- Make children inherit
- Limits: lets you choose
between the following options:
-
Select the Options... contextual menu.
-
Select the desired parameters in the X Axis dialog box.
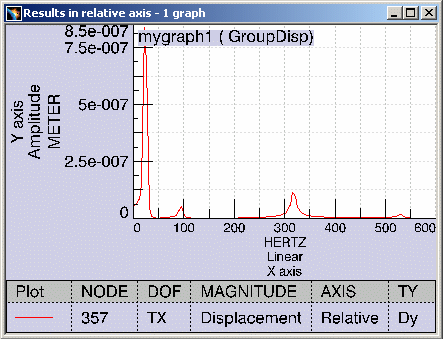
In this particular example,
- select Fixed limits in the Limits tab,
- enter 600 as Upper value,
- select the Customized option in the Text Style tab,
- enter 2.00 as Size value.
-
Click OK in the X Axis dialog box.
The x axis appears as shown here:
![]()
Editing Y Axis Parameters
You will see here how to edit the y axis system.
-
Right-click the y axis.
The following contextual menus are available.
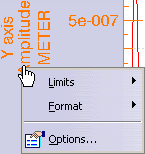
- Limits: for more details, click here.
- Format:
- Real
- Imaginary
- Phase degrees
- Phase radians
- Amplitude
- Logarithmic
- dB(RMS)
- dB(Peak)
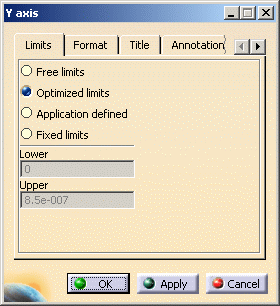
- Options...: lets you access the Y Axis dialog box.
You can also double-click the Y Axis to access the Y Axis dialog box.
-
Select the Options... contextual menu.
-
Select the desired parameters.
-
Click OK in the Y Axis dialog box.
![]()
Editing Plot Parameters
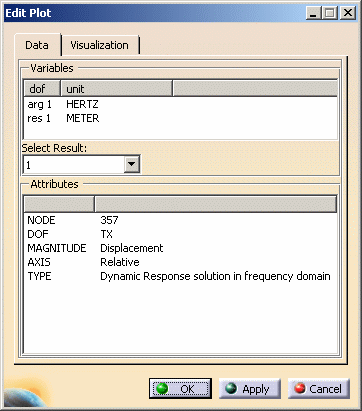
You will see here how to edit the plot.
-
Right-click the plot.
-
Select the Export Data... contextual menu.
-
Select the desired directory and enter a name in the Export Data dialog box.
-
Select Excel as Save as type option in the Export Data dialog box.
-
Click OK in the Export Data dialog box.
To visualize an example of Excel export data file, click here.
To visualize an example of Text export data file, click here.
![]()
Editing Legend Parameters
You will see here how to edit the legend.
-
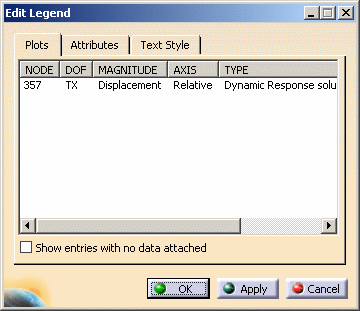
Double-click the graph legend.
- Plots tab: lets you visualize details of attributes
- Show entries with no data attached
- Attributes tab:
- Hide Attributes: lets you hide an attribute in the legend
- Show Attributes: lets you show an attribute in the legend
- Up and Down: let you change the position of attributes in the legend
- Text Style tab: for more details, click here.
- Plots tab: lets you visualize details of attributes
-
Select the desired parameters.
-
Click OK in the Edit Legend dialog box.
-
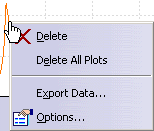
Right-click the graphic legend.
The following contextual menus are available.

![]()
Editing Display Parameters
You will see here how to edit the background.
-
Right-click the display area.
The following contextual menus are available.

- Select Data: lets you access to the Select Data
dialog box.
For more details, refer to Generating a 2D Display for Dynamic Response Solution. - Options...: lets you access the Edit Display dialog
box.
You can also double-click the plot to access the Edit Display dialog box.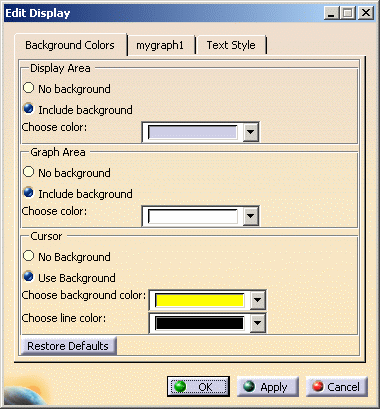
- Background Colors tab:
- Display Area: lets you choose the display area color. You can choose to have no background color (No background) or have a background color (Include background and Choose color).
- Graph Area: lets you choose the graph area color. You can choose to have no background color (No background) or have a background color (Include background and Choose color).
- Cursor: lets you choose the background
color for values displayed using the Cursor
contextual menu. You can choose
to have no background color (No background) or
have a background color (Use background and
Choose background color).
You can also choose the color of the cursor line (Choose line color). - Restore Defaults: lets you restore the default parameters.
- myraph1 tab:
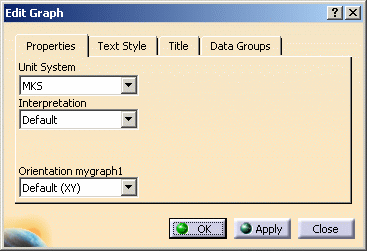
- Properties:
- Units: MKS, Data Defined, Options Defined
- Interpretation: Default
- Orientation: Default (XY), YX
- Title: for more details, click here.
- Data Group Map tab: Application, Image.
- Properties:
- Text Style tab: for more details, click here.
- Background Colors tab:
- Image options...: lets you access the Edit Image
dialog box.
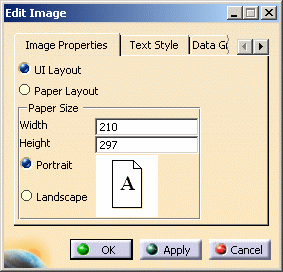
- Image Properties tab:
- UI Layout: lets you display the graph in a window.
- Paper Layout: lets you display the graph in a page mode.
- Paper Size: lets you set the size of the
page mode (Width, Height,
Portrait or Landscape layout).
These options are only available if you selected the Paper Layout option.
- Text Style tab: for more details, click here.
- Data Group Map tab:
- Application
- Image
- Image Properties tab:
- Select Data: lets you access to the Select Data
dialog box.
-
Select the desired parameters.
-
Click OK in the Edit Display dialog box.
![]()
Editing Graph Parameters
You will see here how to edit the graph.
-
Right-click the graph area.
The following contextual menus are available.
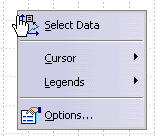
- Select Data: lets you access to the Select Data
dialog box.
For more details, refer to Generating a 2D Display for Dynamic Response Solution. - Cursor: lets you visualize a
value corresponding to a particular abscissa or a particular
ordinate.
- Single X:
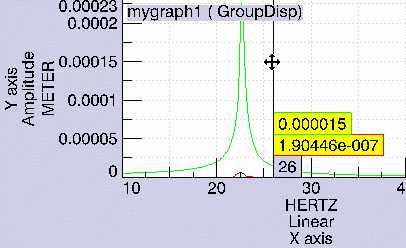
- Double X:
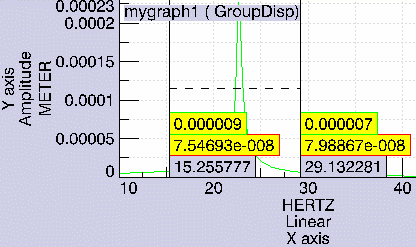
- Single Y:
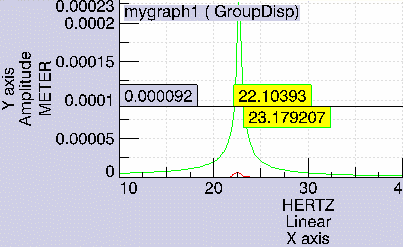
- Single X:
- Legends: lets you hide or show the graph legend.
- Options...: lets you access the Edit Graph dialog
box.
You can also double-click the plot to access the Edit Graph dialog box.
- Select Data: lets you access to the Select Data
dialog box.
-
Select the desired parameters.
-
Click OK in the Edit Display dialog box.
![]()
