This task shows how to extract the desired data and generate a report for computed solutions.
An advanced report is an extract summary of an objects set computation results and status messages, captured in a .html file.
Only available with the ELFINI Structural Analysis (EST) product.
- Open the sample56.CATAnalysis document from the samples directory.
- Compute the solution: to do this, click Compute
 .
.
You can customize the advanced report settings.
For more details about the report settings, refer to
Reporting
in the Customizing section of this guide.
-
Create an image. In this particular example, click the Deformation icon
 .
. -
Click the Generate Advanced Report icon
 .
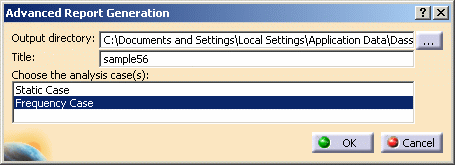
.The Advanced Report Generation dialog box appears.

- Output directory: lets you change the directory in
which you will store the .html advanced report.

The last selected path is automatically proposed.
- Title of the report: lets you modify the title of the .html advanced report.
- Choose the analysis case(s): lets you choose the
analysis case for which you want to work.

Multi-selection of analysis cases is available.
- Output directory: lets you change the directory in
which you will store the .html advanced report.
-
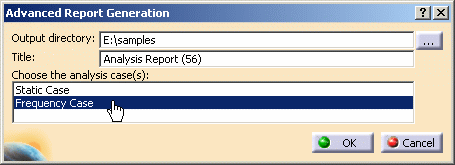
Modify the Output directory by clicking the ... button and choose the desired path.
-
Modify the name of the report if needed.
In this particular example, enter Analysis Report (56) as Title of the report option.
-
Choose the desired analysis cases.
In this particular example, select Frequency Case.

-
Click OK in the Advanced Report Generation dialog box.
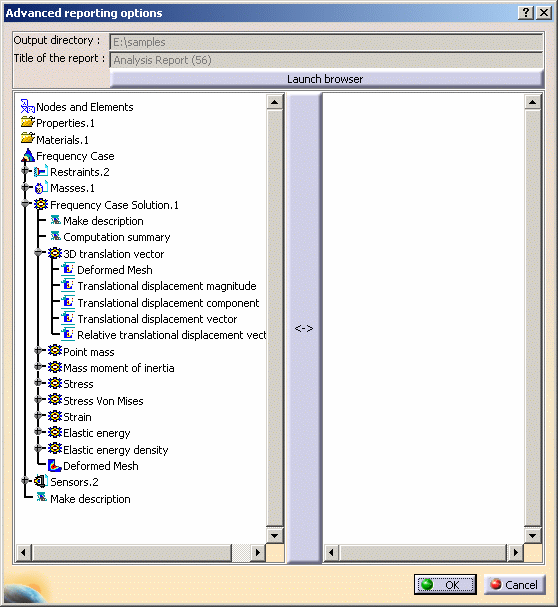
The Advanced reporting options dialog box appears and lets you define which information you wish to extract from all the specifications before launching the browser, creating and if needed updating the output Report file.

There are two windows in the Advanced reporting options dialog box. The left window displays the data corresponding to the specification tree. The right window displays the data which you want to appear in the advanced report:
- Left window: contains all the entities you can export in the
report. You can select a node to expand it (you can also
double-click the entity associated to this node). The entity types
are:
- Text:
- Make description
- Computation summary
- Images: grouped according to the physical types. Each time
you add an image in the report, the representation is performed
using the current viewpoint.
- pre-defined images
- user images
- Text:
- Right window: contains all the entities which will be contained in the report.
- Launch browser: this button lets you launch the .html navigator.
- Left window: contains all the entities you can export in the
report. You can select a node to expand it (you can also
double-click the entity associated to this node). The entity types
are:
-
Select all the desired entities.
In this particular example, double-click:
- Make description (under Frequency Case Solution.1),
- Translational displacement magnitude (under 3D translational vector) as pre-defined image,
- Deformed Mesh (under Frequency Case Solution.1) as user image.
-
Click OK.
In addition to the HTML report file, the program also generates a text (.txt) file in the same output directory.
![]()