This procedure has the following sections:
Open Data Readout Dialog Boxes
-
Click Data Readout
 .
.The Options pop-up toolbar appears; Display  appears highlighted by default.
-
Select the item (i.e., robot, device, mechanism, or manikin) about which you wish to receive data.
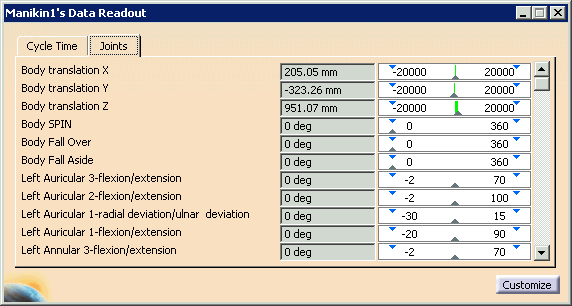
The item's Data Readout dialog box appears, with more than one tab. The tabs available in the dialog box varies depending on the item you selected. Click on the tab name below to see the contents associated with the tab: - Robot or machine: Cycle Time, Joints, TCP, I/O Signals*, Turn Numbers*
- Device or mechanism: Cycle Time, Joints
- Manikin: Cycle time,
Joints, I/O signals*
*if available
-
Select the tab with the desired information.
-
(Optional) Repeat Steps 2 and 3 for all the items about which you wish to have Data Readout dialog box open.
-
(Optional) Customize the readout so that you can see multiple categories of data at once.
-
Exit Data Readout
 using one of the methods below:
Click the highlighted Data Readout  ,
OR
,
ORClick on the X (close) button in the upper right corner of the Options pop-up toolbar.
-
Run the simulation to see the data readout on the item(s) selected.
Use Data Readout in Conjunction with Process Simulation
-
Select the Data Readout dialog boxes you want to see
-
Exit Data Readout
 .
.
The dialog boxes remain up while the simulation becomes reactivated.
-
Use Data Readout
 to select the Data Readout dialog boxes you want to see,
 -
Exit Data Readout

-
Click Process Simulation
 .
.
Customize the Data Readout Dialog Boxes
-
Click the Customize button on the Data Readout dialog box.
The Customize dialog box appears. The example below shows robot data; however the principles for customizing apply to devices and manikins as well. 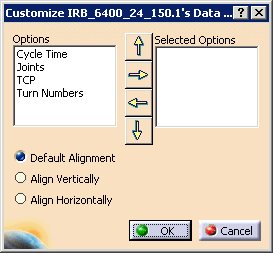

- If there is an I/O tab, I/O appears in the Options list.
- If the robot does not allow Turn Numbers, Turn Numbers does not appear in Options.
-
Select the tabs whose information you want to see displayed on one tab and use the right arrow to move the names of the tabs into the Selected Options box.

The left arrow moves an item out of the Selected Options box and back into Options. The up arrow moves an item up one place in the list; the down arrow moves an item down one place. The order in which the items appear in the list determines the order in which you see them in the customized tab. For vertical alignment, the first item is on top; for horizontal alignment, the first item is left-most. -
Select either Align Vertically or Align Horizontally alignment and then click OK.
The vertical alignment appears below. 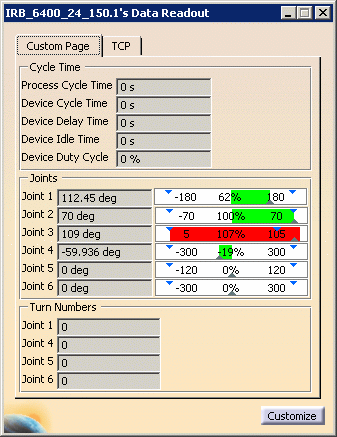
The horizontal alignment appears below. 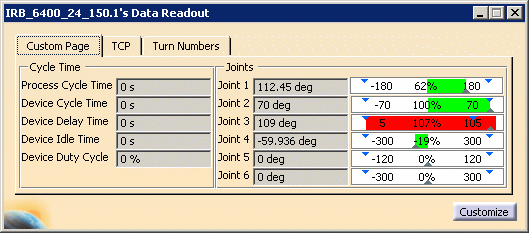
If you decide you do not want to change the current customization after the Customize dialog opens, you can click Cancel, without affecting the existing Data Readout dialog box.
Any previously set behavior of hiding/showing the Data Readout dialog box is maintained for the customized dialog. For instance, suppose you open the Data Readout dialog box for a certain device, customized the dialog box, and then close the Data Readout dialog box. When you reopen the Data Readout dialog box, the previous customization is remembered and used.
This customization can be done independently for each device. For example, you customize the Data Readout dialog box for a specific robot to show the Cycle Time and the Joint values on the same page, aligned horizontally. Then you can select the Joint values and the TCP data for a different robot, and have the data aligned vertically.
About Robot Data Readout Dialog Boxes
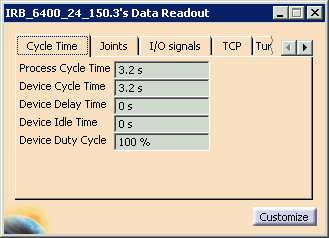
Robot Data Readout Dialog Box: Cycle Time Tab
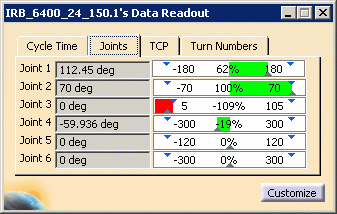
Robot Data Readout Dialog Box: Joints Tab
Robot Data Readout Dialog Box: I/O Signals Tab

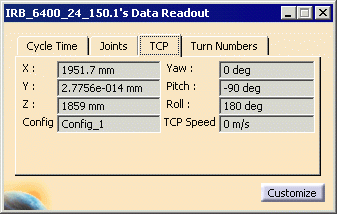
Robot Data Readout Dialog Box: TCP Tab
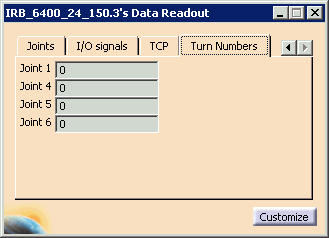
Robot Data Readout Dialog Box: Turn Numbers Tab
About Device Data Readout Dialog Boxes
Device Data Readout Dialog Box: Cycle Time Tab
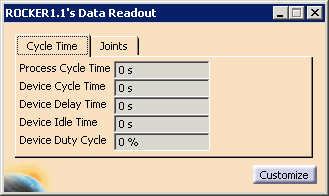
Device Data Readout Dialog Box: Joints Tab
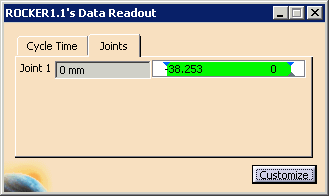
About Manikin Data Readout Dialog Boxes
Manikin Data Readout Dialog Box: Cycle Time Tab

Manikin Data Readout Dialog Box: Joints Tab
