-
Click Open Gantt Chart
 .
.
-
From the menu, select Window > Tile Vertically.
-
Select a process, click Process Simulation
 ,
then play the simulation.
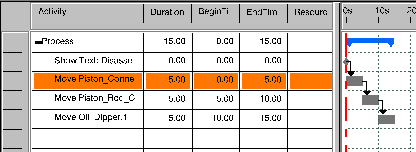
 As the simulation progresses, each activity in the simulation becomes highlighted in turn. In addition, you can set an option to show a bar that moves along the timeline to show the current simulation time. See Tools > Options > Digital Process for Manufacturing > Gantt Chart. 
-
Repeat this procedure, using Open PERT Chart
 in Step 1.
 The currently simulated activities are highlighted as the simulation progresses. 
-
To end the simulation:
- Press the X (close) button in the upper right hand corner of the Process Simulation pop-up toolbar OR
- Click Process Simulation (the command changes from orange to its original colors).