- This type of analysis is performed based on color ranges identifying
zones on the analyzed element where the deviation from the draft
direction at any point, corresponds to specified values.
These values are expressed in the unit as specified in Tools > Options > General > Parameters > Unit tab.
You can modify them by clicking on their corresponding arrow or by entering a value directly in the field. - The mapping texture accuracy depends of the video card used.
Therefore, colors displayed on surfaces could be wrong according to the
color scale, when the value displayed on the fly is right because the
analysis is recomputed at the cursor location.
Sometimes, in the case of extremely closed values, it is recommended to switch to the Quick mode to improve the color display accuracy. - The maximal draft analysis accuracy is 0.1 deg. According to the graphic card performance, this accuracy can be debased.
- The different mapping analyses of the same surfaces cannot be displayed simultaneously, even if you have set the mapping analyzes in no show. You need to visualize them one after the other.
This command is only available with:
-
FreeStyle Shaper 2
-
Part Design 2
-
Generative Shape Design 2
-
Wireframe and Surface for Building 1.
- The visualization mode should be set to Shading With Edges in the View > Render Style command
- The discretization option should be set to a maximum: in Tools > Options > Display > Performances, set the 3D Accuracy > Fixed option to 0.01.
- Check the Material option in the View > Render Style > Customize View command to be able to see the analysis results on the selected element. Otherwise a warning is issued.
- Uncheck the Highlight faces and edges option in Tools > Options > Display > Navigation to disable the highlight of the geometry selection.
- OpenGL shader technology can be used with this functionality, please refer to the Infrastructure Installation Guide documentation for more details on software & hardware prerequisites: Software Requirements. See Performance setting.
- The different mapping analyses of the same surfaces cannot be displayed simultaneously, even if you have set the mapping analyzes in no show. You need to visualize them one after the other.
-
Select a surface.
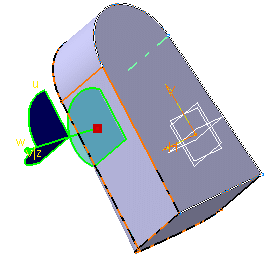
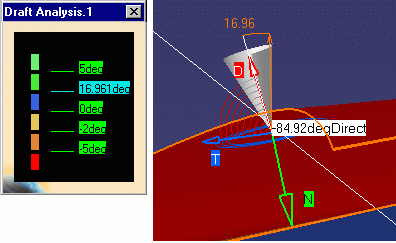
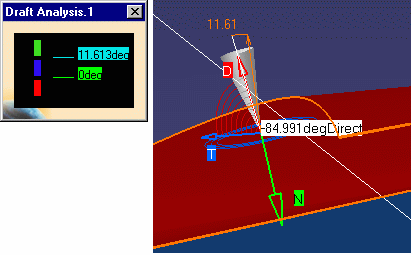
The Draft Analysis dialog box is
displayed. It gives information on the display (color scale), the draft
direction and the direction values.
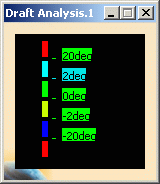
The Draft Analysis.1 dialog box showing the color scale and
identifying the maximum and minimum values for the analysis is displayed
too.
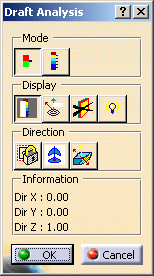
Mode option
The mode option lets you choose between a quick
and a full analysis mode. These two modes are completely independent.
The default mode is the quick mode. It simplifies the analysis in that it
displays only three color ranges.
-
Quick mode:

-
Full mode, this mode is P2-only:
-
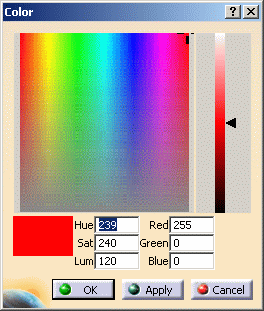
Double-click on a color in the color scale to display the Color dialog box in order to modify the color range.
-
Exit the dialog box.
-
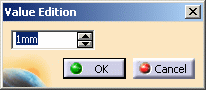
Double-click on the value in the color scale to display the Value Edition dialog box.
-
Enter a new value (negative values are allowed) to redefine the color scale, or use the slider to position the distance value within the allowed range, and click OK.
-
The value is then frozen, and displayed in a green rectangle.
-
The color scale settings (colors and graduated values) are saved when exiting the command, meaning the same settings will be applied when you will edit a draft analysis. New settings are created with each new draft analysis.
-
When the draft angle value of the surface is equal or smaller than a graduated value, the color below the graduated value is applied.
-
When the draft angle value of the surface is greater than the greatest graduated value, the color above this graduated value is applied.
-
Exit the dialog box.
Display option
-
Uncheck the Color Scale checkbox to hide the Draft Analysis.1 dialog box, this dialog box only appears in edition mode.
-
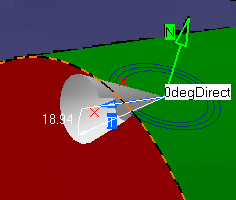
Activate the On the fly checkbox and move the pointer over the surface. This option enables you to perform a local analysis.
Arrows are displayed under the pointer, identifying the normal to the surface at the pointer location (green arrow), the draft direction (red arrow), and the tangent (blue arrow). As you move the pointer over the surface, the display is dynamically updated. Furthermore, circles are displayed indicating the plane tangent to the surface at this point.
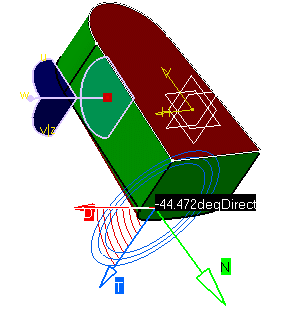
The displayed value indicates the angle between
the draft direction and the tangent to the surface at the current point.
It is expressed in the units set in using the Tools > Options >
General > Parameters > Units tab.
The On the fly analysis can only be performed on the elements of the current part.
Note that you can activate the On the fly option even when not visualizing the materials. It gives you the tangent plane and the deviation value.
-
Click the Inverse
 button to automatically
reverse the draft direction.
button to automatically
reverse the draft direction.
When several elements are selected for analysis, the draft direction is inverted for each element when the button is clicked.
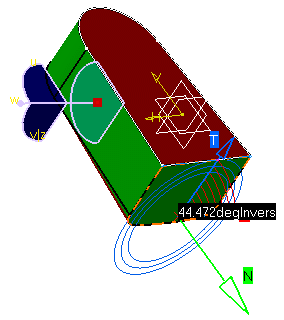
In case of an obviously inconsistent result, do not forget to invert locally the normal direction via the Inverse button.
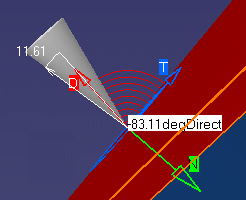
The manipulator on the draft direction allows you to materialize the cone showing the angle around the direction:
-
Direction in the cone:
-
Direction out of the cone:
-
Right-click the cone angle to display the Angle Tuner dialog box.
When you modify the angle using the up and down arrows, the value is automatically updated in the color scale and in the geometry.
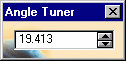
Note that you cannot modify the angle below the minimum value or beyond the maximum value.
Full mode:
-
Quick mode:
-
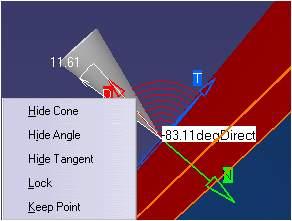
Right-click the Direction vector to display the contextual menu.
From the contextual menu you can:
-
Hide/show the cone.
-
Hide/show the angle.
-
Hide/show the tangent.
-
Lock/unlock the analysis position.
-
Keep the point at this location, this command is P2-only
A Point.xxx appears in the specification tree.
Direction
By default the analysis is locked,
meaning it is done according to a specified direction: the compass w axis.
In P1 mode, the default analysis direction is the general document
axis-system's z axis.
-
Click the Locked direction icon
 , and select a direction (a line,
a plane or planar face which normal is used), or use the compass
manipulators, when available.
, and select a direction (a line,
a plane or planar face which normal is used), or use the compass
manipulators, when available.
-
Using the compass manipulators:
-
Selecting a specific direction:

-
Click the Compass icon
 to define the new current
draft direction.
to define the new current
draft direction.
-
The compass lets you define the pulling direction that will be used from removing the part.
-
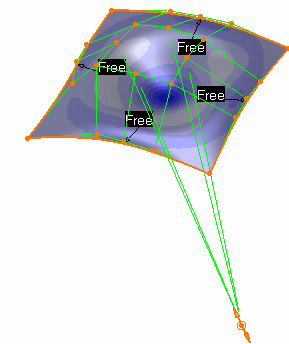
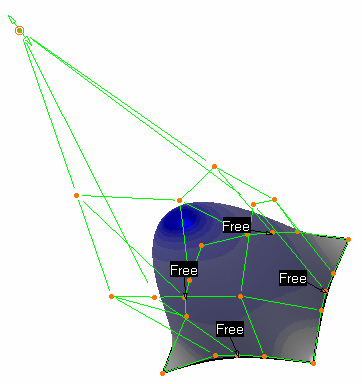
You can display the control points by clicking the Control Points
 icon, yet the draft analysis is still visible, then allowing you to check
the impact of any modification to the surface on the draft analysis.
icon, yet the draft analysis is still visible, then allowing you to check
the impact of any modification to the surface on the draft analysis.
-
Once you have finished analyzing the surface, click OK in the Draft Analysis dialog box.
The analysis (identified as Draft Analysis.x) is added to the specification tree. The persistency of the draft analysis is P2-only.
-
Note that settings are saved when exiting the command, and redisplayed when you select the Draft Analysis icon again.
-
Be careful, when selecting the direction, not to deselect the analyzed element.
-
A draft analysis can be performed just as well on a set of surfaces.
-
If an element belongs to an analysis, it cannot be selected simultaneously for another analysis, you need to remove the current analysis by deselecting the element to be able to use it again.
-
In some cases, even though the rendering style is properly set, it may happen that the analysis results are not visible. Check that the geometry is up-to-date, or perform an update on the involved geometric elements.
-
The analysis results depend of the current object. May you want to change the scope of analysis, use the Define in Work object contextual command.