 |
This task shows how to analyze
the connections between curves' extremities, and between a curve's
extremities and its projection on a curve, following a blend, or match operation.
|

|
Checking Connections between Curves' Extremities
|
 |
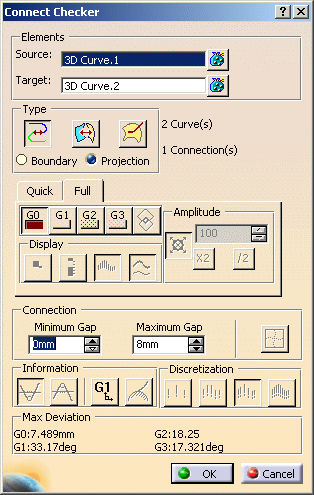
Open the
FreeStyle_09.CATPart document. |
|
|
-
Select both curves to be analyzed.
-
Click the Curve-Curve Connection icon
 in the Connect Checker analysis dashboard.
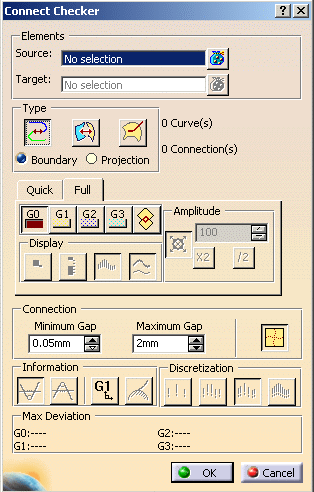
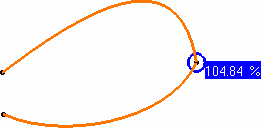
At the same time a text is displayed on the geometry,
indicating the value of the connection deviation.
-
Select either of the options: G0,
G1, G2, G3, or Overlap.
-
You can choose the type
of analysis to be performed using the combo: G0, G1, G2, G3, or Overlap.
-
Set Min/Max value: In case of G2 analysis, if the
concavity option is active a white circle enables to indicate whether
there is a concavity defect between the curves.
|
 |
Concavity Defect:
In case of G2 analysis, if the concavity option is active a computation
of angle between the two osculator planes enables to evaluate the
concavity defect. This information is available only in full analysis
mode. The angle value is displayed only when it is greater than 0.01
degrees in a white tag. Moreover a white circle enables to locate the
defect.
|
|
|
 |
|
|
-
Press the Quick button.
The dialog box changes along with the text on the
geometry.
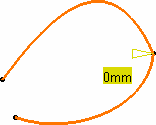
With our example, the text in the geometry disappears because the
distance between the two curves is smaller than the set Distance value.
|
|
-
Check the G1 button:
A text is displayed on a green background (as defined by
default for the G1 criterion) to indicate that the G1 criterion is not respected, because the first text displayed is the one
for which the set tolerance is not complied with. You can then increase
the Tangency value, or modify the geometry to comply with your needs.
|
| |
|
|
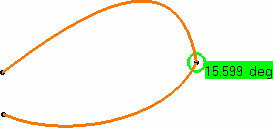
-
Similarly, if you check the G2 value,
the displayed text indicates that the curvature between the two analyzed
curves is greater than the set value.
-
Modify the tolerance values, or the geometry to comply
with the tolerances.
For example, if you modify the G1 value to set it
to 16 degrees, the geometry instantly reflects the compliance with the
new value.
|
| |
|
|
|
The maximum deviation values on the current
geometry are displayed at the bottom of the dialog box. |
|
-
Click OK to create the analysis.
The analysis (identified as Connect Checker Analysis.x)
is added to the specification tree.
This allows the automatic update of the analysis when you modify any of
the curves, using the control points for example (see
Editing Curves
Using Control Points).
-
If you do not wish to create the analysis, simply click
Cancel.
|
 |
|
|
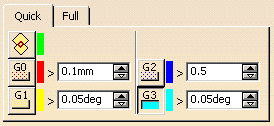
- You can analyze internal edges of a element, such as a Join for
example, by selecting only one of the initial elements:
|
| |

|
|
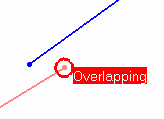
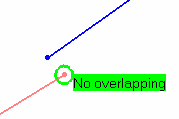
- Use the Overlapping mode to highlight where, on the
common boundary, the two curves overlap.
In Full Analysis mode, a text is displayed indicating whether the curves overlap.
|
|
|
 |
|
Checking Connections Between Curve's Extremity and Its Projection on a
Curve
|
| |
|
|
|
-
Open the
FSS_CCK_Curve_Curve01.CATPart
document.
|
| |
-
Select both curves to be analyzed.
-
Click the
Curve-Curve Connection
icon
and
Projection
option in the Connect
Checker
analysis dashboard.
The
Connect Checker
dialog box is
displayed as well as another dialog box showing the color scale and
identifying the maximum and minimum values for the analysis type.
|
| |
|
| |
The Auto Min Max button enables to
automatically update the minimum and maximum values (and consequently all
values between) each time they are modified.
|
| |
-
Set the Maximum gap
above which no analysis will be performed. All elements apart from a
greater value than specified in this field are considered as not being
connected, therefore do not need to be analyzed.
-
Be careful not to set a Maximum gap
greater than the size of the smallest surface present in the document.
-
Set the Minimum Gap To get connection between two input
elements, the gap between those two elements must be greater than or
equal to Minimum Gap.
-
Select either of the options: G0,
G1, G2, or G3. You can choose the type
of analysis to be performed using the combination: G0, G1, G2, or G3. The Overlap
option is not available in Projection for the Curve-Curve option.
-
Check the analysis results on the geometry. The subsequent sections show the result of
connecting two curves with a combination between G0, G1, G2 or
G3 and Projection.
|
|
|
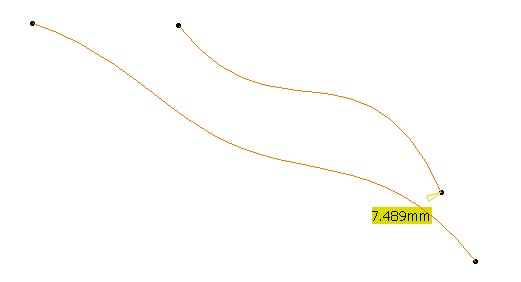
G0 Continuity
|
| |
The following image shows the G0 continuity analysis between two
curves:
 |
|
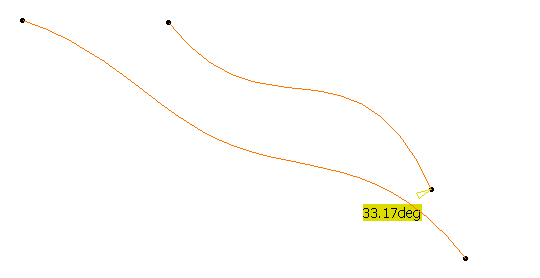
G1 Continuity
|
| |
The following image shows the G1 continuity analysis
between two curves:
 |
|
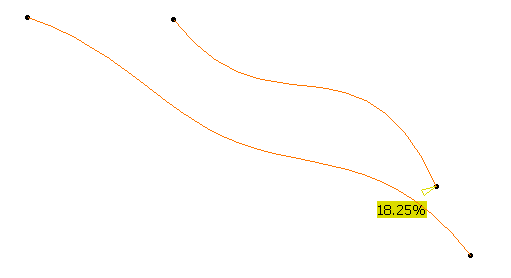
G2 Continuity
|
| |
The following image shows the G2 continuity analysis between two curves:
 |
|
|
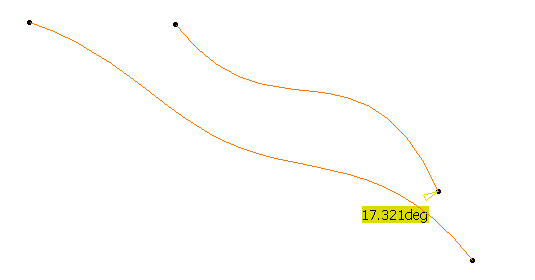
G2 Continuity
|
| |
The following image shows the G3 continuity analysis between two curves:
 |
| |
|