- Surfacic curvature analyses can be performed on a set of surfaces.
- If an element belongs to an analysis, it cannot be selected simultaneously for another analysis, you need to remove the current analysis by deselecting the element to be able to use it again.
- In some cases, even though the rendering style is properly set, it may happen that the analysis results are not visible. Check that the geometry is up-to-date, or perform an update on the involved geometric elements.
- The analysis results depend of the current object. If you want to change the scope of analysis, use the Define in Work object contextual command.
- The different mapping analyses of the same surfaces cannot be displayed simultaneously, even if you have set the mapping analyzes in no show. You need to visualize them one after the other.
This command is only available with:
-
FreeStyle Shaper 2
-
Part Design 2
-
Generative Shape Design 2
-
Wireframe and Surface 1.
- The discretization option should be set to a maximum: in Tools > Options > Display > Performances, set the 3D Accuracy > Fixed option to 0.01
- Uncheck the Highlight faces and edges option in Tools > Options > General > Display > Navigation to disable the highlight of the geometry selection.
- Check the Material option in the View > Render Style > Customize View command to be able to see the analysis results on the selected element. You can now perform an analysis On the Fly even if the Material option is not checked, see On the Fly option. No warning message is issued as long as no element is selected.
-
Select Surface.1.
-
Click the Surfacic Curvature Analysis icon:

The Surfacic curvature dialog box is displayed, and the analysis is visible on the selected element.
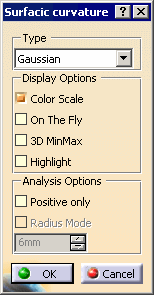
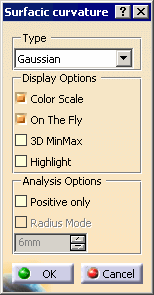
The Surfacic curvature dialog box displays the following information:
-
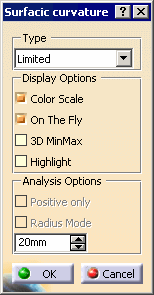
Type analysis option allows you to make the following analyses:
-
Gaussian
-
Minimum
-
Maximum
-
Limited
-
Inflection Area
-
-
Display Options are:
-
Color Scale option allows you to display the Surfacic Curvature Analysis.n (n= 1, 2, 3, etc) dialog box associated with the current analysis.
-
On the Fly option allows you to make a local analysis:
-
The On the fly analysis can be performed on the elements, selected or not, of the current part only. It is not available with the Inflection Area analysis type.
-
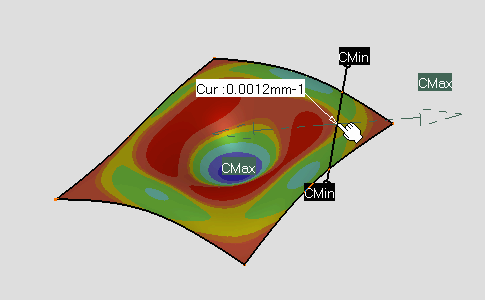
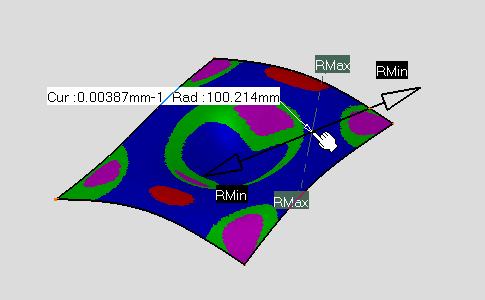
The curvature and radius values are displayed at the cursor location (for Gaussian analysis radius value is not displayed), as well as the minimum and maximum curvature values and the minimum and maximum curvature directions. As you move the pointer over the surface, the display is dynamically updated.
-
The displayed values may vary from the information displayed as the Use Max/Use Min values, as it is the precise value at a given point (where the pointer is) and does not depend on the set discretization.
-
You cannot snap on point when performing an On the Fly analysis.
-
Click a location and right-click the On the Fly curvature/radius label to display the contextual commands.
These commands are not available in P1 mode:-
Keep Point: create the point at the clicked location.
-
Keep Min Point: create the point corresponding to the minimum value.
-
Keep Max Point: create the point corresponding to the maximum value.
-
-
3D MinMax option allows you to locate the minimum and maximum values for the selected analysis type, except for Inflection Area analysis type.
-
Highlight option allows you to disable the Highlight faces and edges option in Tools > Options > General > Display > Navigation which highlight of the geometry selection.
-
-
-
Analysis Options are:
-
Positive only option allows you to get analysis values as positive values, available with Gaussian, Minimum and Maximum analysis types only.
-
Radius Mode option allows you to get analysis values as radius values, available with Minimum and Maximum analysis types only.
-
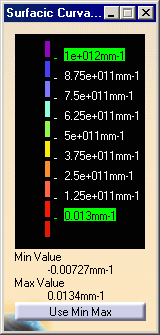
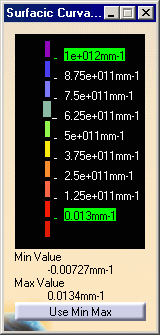
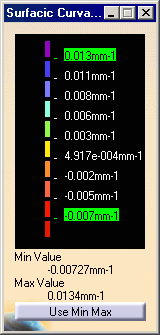
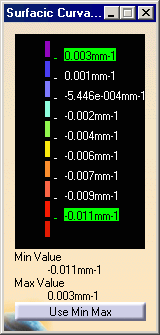
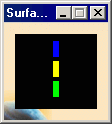
The Surfacic Curvature Analysis.1
dialog box appears and shows the color scale and identifying the maximum
and minimum values for the analysis.
-
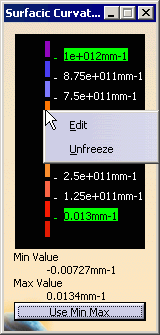
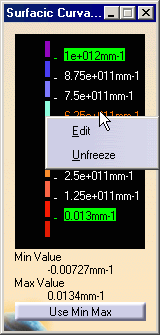
You can right-click on a color rectangle in the color scale to display the contextual menu:
-
Edit contextual command allows you to modify the values in the color range to highlight specific areas of the selected surface. The Color dialog box is displayed allowing the user to modify the color range.
-
Unfreeze contextual command allows you to perform a linear interpolation between non defined colors.
-
-
You can also right-click on the value to display the contextual menu:
-
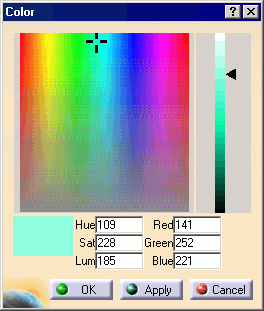
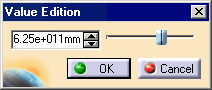
Edit contextual command allows you to modify the edition values.
The Value Edition dialog box is displayed: enter a new value (negative values are allowed) to redefine the color scale, or use the slider to position the distance value within the allowed range, and click OK.
The value is then frozen, and displayed in a green rectangle.
-
Unfreeze contextual command allows you to perform a linear interpolation between non defined values, meaning that between two set (or frozen) colors/values, the distribution is done progressively and evenly. This command is available for all values except for maximum and minimum values.
The unfreezed values are no longer highlighted in green. -
Use Max / Use Min contextual commands allow you to evenly distribute the color/value interpolation between the current limit values, on the top/bottom values respectively, rather than keeping it within default values that may not correspond to the scale of the geometry being analyzed. Therefore, these limit values are set at a given time, and when the geometry is modified after setting them, these limit values are not dynamically updated.
-
These commands are available for maximum and minimum values only.
-
The Use Max command is available if the maximum value is higher or equal to the medium value, otherwise you need to unfreeze the medium value first.
-
The Use Min command is available if the minimum value is lower or equal to the medium value, otherwise you need to unfreeze the medium value first.
-
-
-
Use Min Max button in the Surfacic Curvature Analysis.1 dialog box makes in one action both Use Max / Use Min contextual commands operation.
-
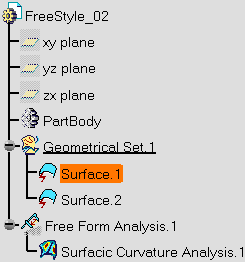
The Surfacic Curvature Analysis.1 is created in the specification tree under the Free Form Analysis.1
Analysis Types and Display Options
-
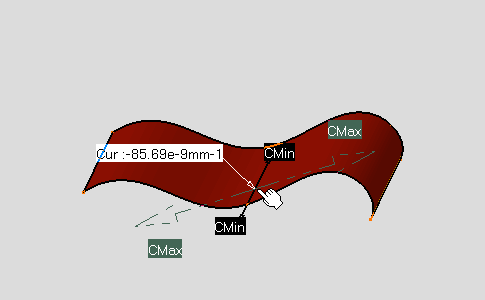
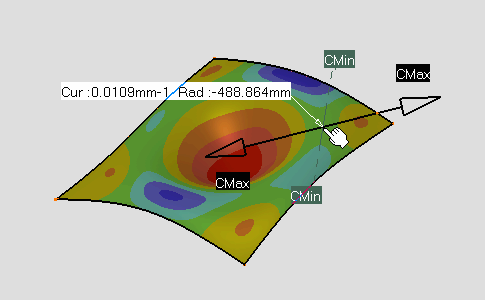
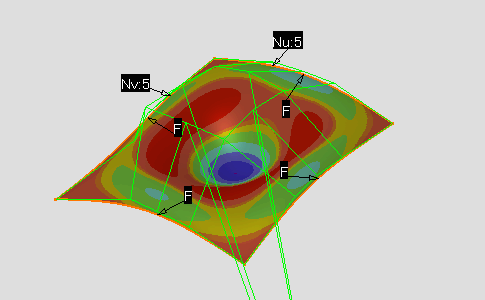
Select the Gaussian analysis type and the On the Fly option.
-
Click the Use Min Max button in the Surfacic Curvature Analysis.1 dialog box.
Maximum and minimum values are set according to the computed values displayed below the color scale.
-
Move the cursor on the surface.
You can also right-click On the Fly curvature/radius label to display the contextual commands, see On the Fly option.
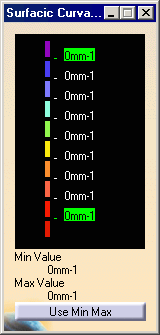
Case of a Ruled Surface
-
Select Surface.2
-
Click the Use Min Max button in the Surfacic Curvature Analysis.1 dialog box.
Values are equal to 0.
-
Move the cursor on the surface.
-
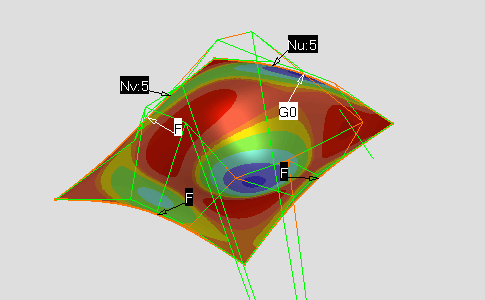
Select Surface.1
-
Select the Minimum analysis type.
-
Click the Use Min Max button in the Surfacic Curvature Analysis.1 dialog box.
-
Move the cursor on the surface.
Minimum curvature and radius values are displayed.
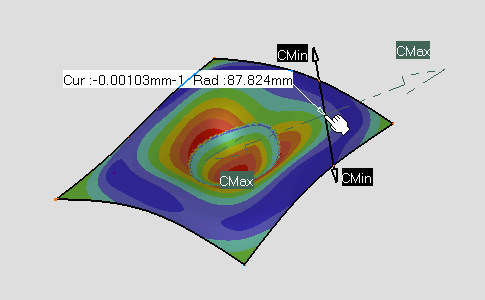
The color scale in the Surfacic Curvature
Analysis.1 dialog box corresponds to the previous type analysis
(Gaussian).
The color scale doesn't change when you select another analysis type or
element. This behavior allows you keep a reference when you compare
curvature values.
-
Select the Maximum analysis type.
-
Click the Use Min Max button in the Surfacic Curvature Analysis.1 dialog box.
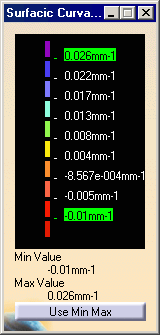
-
Move the cursor on the surface.
Maximum curvature and radius values are displayed.
-
Select the Limited analysis type.
In the Surfacic curvature dialog box:
-
You are able to modify the radius value. The value is automatically updated in the color scale.
-
Positive only and Radius mode options have been disabled.
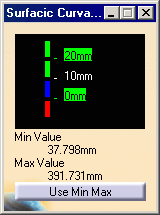
The Surfacic Curvature Analysis.1
dialog box has been modified: the color scale has been reduced: four colors
and three values.
-
Edit the top color and the maximal and minimal values in the Surfacic Curvature Analysis.1 dialog box as follow, see Edit color and Edit edition values.
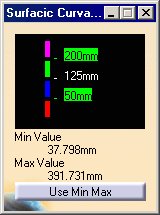
Minimum curvature and radius values are displayed.
-
Select the Inflection Area analysis type.
In the Surfacic curvature dialog box only the Color Scale and Highlight options are available.
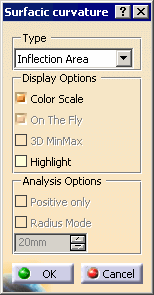
The Surfacic Curvature Analysis.1 dialog box has been modified.
This analysis enables to identify the curvature orientation:
-
In green: the areas where the minimum and maximum curvatures present the same orientation.
-
In blue: the areas where the minimum and maximum curvatures present opposite orientation.
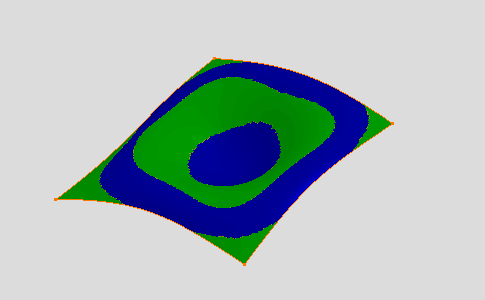
See also Creating Inflection Lines. Note that these inflection lines are always created within the green area, i.e. when the curvature orientation is changing.
-
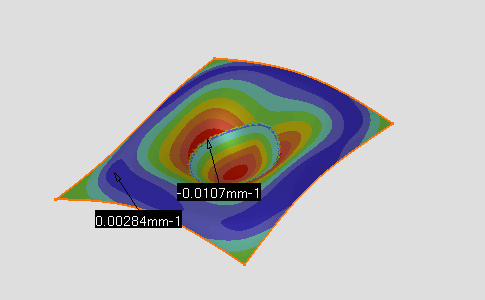
Select the Minimum analysis type and the 3D MinMax option.
-
Click the Use Min Max button in the Surfacic Curvature Analysis.1 dialog box.
Maximum and minimum values are displayed and located on the selected element according to the computed values displayed below the color scale.
Analysis Options
-
Select the Positive only option and keep unselected the Radius Mode option.
-
Click the Use Min Max button in the Surfacic Curvature Analysis.1 dialog box.
Minimum value is set to 0 below the color scale.
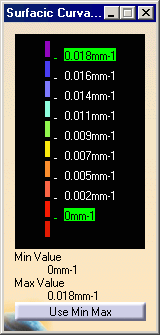
Only positive values are displayed and located on the selected element. Minimum value is set to 0 below the color scale.
-
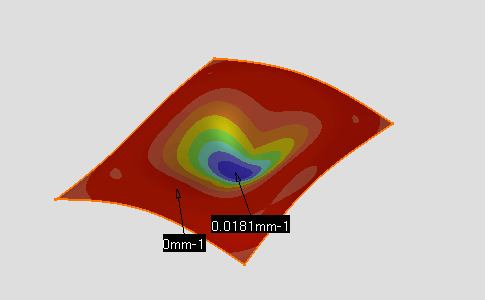
Select the Radius Mode option and unselect the Positive only option.
-
Click the Use Min Max button in the Surfacic Curvature Analysis.1 dialog box.
-
Edit the minimal value in the Surfacic Curvature Analysis.1 dialog box as follow, see Edit edition values.

Maximum and minimum radius values are displayed and located on the selected element according to the computed values displayed below the color scale.
-
Select the Gaussian analysis type.
-
Click the Use Min Max button in the Surfacic Curvature Analysis.1 dialog box.
-
Click OK in the Surfacic curvature dialog box.
-
Click the Control Points icon:

You can display the control points still viewing the surfacic curvature analysis. This allows you to check any modification which affect the surface.
-
Click Cancel in the Control Points dialog box.