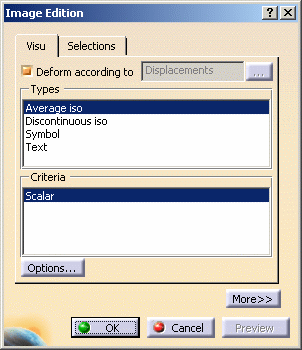
This task describes the Image Edition dialog box.
The names of the images depend on:
- physical type (for example: Displacement)
- visualization type (for example: Symbol or Text)
- criterion (for example: Norm or Vector component)
You will find in the following table the available tabs and buttons in the Image Edition dialog box.
|
|
Mono-occurrence solutions |
Multi-occurrence solutions |
|
Deformed Mesh image |
||
|
Other images |
Mesh Tab

-
Deformed according to: lets you visualize results in deformed mode.

In the case of Dynamic Response Analysis Case (Harmonic or Transient) with restraint excitation, you can specify if you want to visualize the image in an absolute axis (Absolute option) or in a relative axis (Relative option) using the
 button.
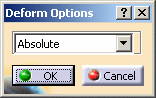
-
Absolute: lets you visualize both the displacement and the elastic deformation of the part.
-
Relative: lets you visualize only the elastic deformation of the part.
-
-
Display free nodes: lets you display free nodes (nodes that are not referenced by any element).
-
Display nodes of elements: lets you visualize nodes of elements.
-
Display small elements: lets you choose to display or not the very small elements.
-
Shrink Coefficient: lets you shrink the element visualization.
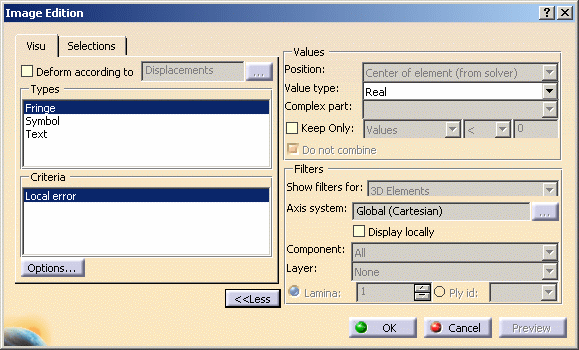
Visu Tab
-
Deformed according to: lets you visualize the deformation.
In the case of Dynamic Response Analysis Case (Harmonic or Transient) with restraint excitation, you can specify if you want to visualize the image in an absolute axis (Absolute option) or in a relative axis (Relative option) using the
button.-
Absolute: lets you visualize both the displacement and the elastic deformation of the part.
-
Relative: lets you visualize only the elastic deformation of the part.
-
-
Type: provides a list with visualization types (how).
The list of visualization types depends on the selected image.Modifying the visualization type can change the value parameters and filter parameters.
- Average iso: lets you visualize isoclines at nodes.

This visualization type uses the Material Rendering capabilities.
-
Discontinuous iso: lets you visualize isoclines at nodes of element.
Visualizing isoclines at nodes of elements may induce a color discontinuity from an element to an other.This visualization type uses the Material Rendering capabilities.
-
Fringe: lets you color an element, a face of element or an edge of element according to the scalar value defined for this entity.
-
Text: lets you visualize results using text.
- Symbol: lets you visualize results using symbol.
The available symbols depend on the values to be displayed.
- Average iso: lets you visualize isoclines at nodes.
-
Criteria: provides a list of visualization criteria.
The list of visualization criteria depends on the physical type of the selected image and the selected Type.Modifying the criteria can change the value parameters and filter parameters.
- Options...: lets you define
visualization options.

Only available if you installed the ELFINI Structural Analysis product.
The dialog box that appears depends on the Type option you previously selected.
For more details about this button, click here.
Options... button
Here you will find the available visualization options you
obtain using the Options... button:
-
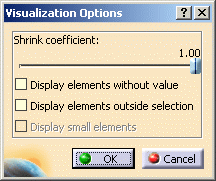
if you selected the Discontinuous iso, Average iso or Fringe type, the Visualization Options dialog box appears as shown below:
-
Shrink Coefficient: lets you shrink the element visualization.
-
Display elements without value: lets you display elements with or without value.
-
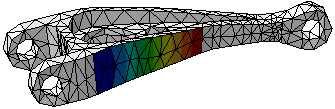
Display elements outside selection: lets you display the elements which are not in the current selection (Activated Groups in the Selections tab) with a white color.
Example:
-
Display small elements: lets you choose to display or not the very small elements.
This option is only available if you selected the Fringe type.
-
-
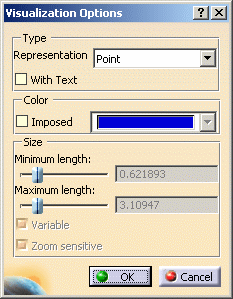
if you selected the Symbol type, the Visualization Options dialog box appears as shown below:
-
Type:
-
Representation: lets you choose between the symbol representation types. The number of the available representations depends on the visualization Type and Criteria.
-
With text: lets you display the values corresponding to each displayed symbol.

You can change the text properties settings using the Tools > Options... menu.
To know more about this setting, refer to Customizing - Post Processing section of the Generative Structural Analysis User's Guide.
-
-
Color:
-
Imposed: enables the color to be fixed.
If this option is selected, you can use the Color Chooser.
-
-
Size:
-
Minimum length: lets you define the minimum symbol length.
-
Maximum length: lets you define the maximum symbol length.
-
Variable: enables the variability of the symbols in function of the value.
-
Zoom sensitive: enables the length of the symbols to be zoom sensitive.
-
-
-
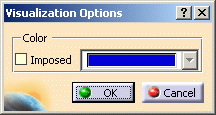
if you selected the Text type, the Visualization Options dialog box appears as shown below:
-
Color:
-
Imposed: enables the color to be fixed.
If this option is selected, you can use the Color Chooser.
-
-
Selections Tab
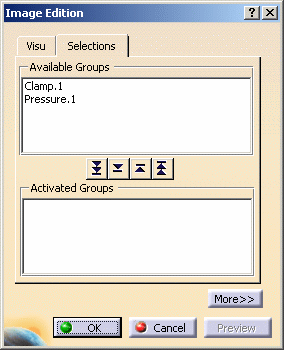
The Selections tab lets you limit the image visualization to a list of entities.
-
Available Groups: gives you the list of the available entities.
The available entities could be:
-
mesh parts (under the Nodes & Elements set in the specification tree)
-
pre-processing specifications (under the Restraints, Loads and Masses sets in the specification tree)
-
user groups (under the Groups set in the specification tree)

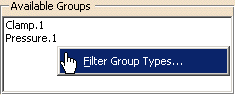
You can filter the list of the available entities using the Filter Group Types... contextual menu.
For more details, refer to Filtering Group Types. -
-
 button:
lets you activate the visualization of all the available entities
contained in the Available Groups frame.
button:
lets you activate the visualization of all the available entities
contained in the Available Groups frame. -
 button:
lets you activate the visualization of entities selected in the
Available Groups frame.
button:
lets you activate the visualization of entities selected in the
Available Groups frame. -
 button:
lets you deactivate the visualization of entities selected in the
Activated Groups frame.
button:
lets you deactivate the visualization of entities selected in the
Activated Groups frame. -
 button:
lets you lets you deactivate the visualization of all the selected
entities contained in the Activated Groups frame.
button:
lets you lets you deactivate the visualization of all the selected
entities contained in the Activated Groups frame. -
Activated Groups: shows you the list of the entities you have activated the visualization.
|
|
|
|
|
|
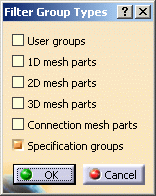
Filtering Group Types
-
Right-click in the Available Groups frame and select Filter Group Types... as shown below:
The Filter Groups dialog box appears.
-
User groups: lets you activate all the groups under the Groups set in the specification tree.
-
1D mesh parts: lets you activate all the 1D mesh parts under the Nodes and Elements set in the specification tree.
-
2D mesh parts: lets you activate all the 2D mesh parts under the Nodes and Elements set in the specification tree.
-
3D mesh parts: lets you activate all the 3D mesh parts under the Nodes and Elements set in the specification tree.
-
Connection mesh parts: lets you activate all the connection mesh parts under the Nodes and Elements set in the specification tree.
-
Specification groups: lets you activate all the entity under the Restraints, Loads and Masses sets in the specification tree.
-
-
Set the desired options.
-
Click OK in the Filter Groups dialog box.
For example, with the following analysis specification tree:
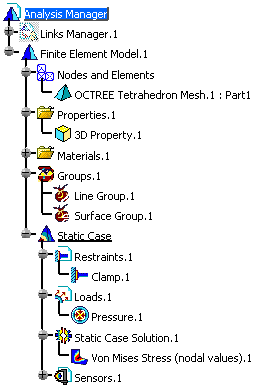
-
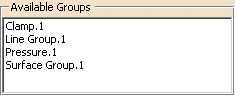
if you select User groups and Specification groups, the Available Groups frame is updated as shown below:
-
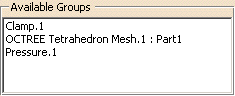
if you select 3D mesh parts and Specification groups, the Available Groups frame is updated as shown below:
Occurrences Tab
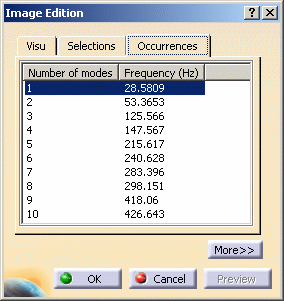
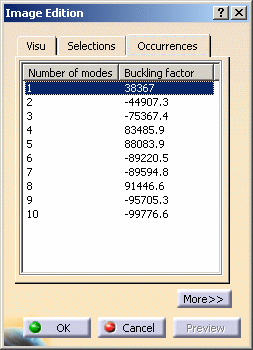
The Occurrences tab is available in the Image Edition dialog box only for multi-occurrence solutions.
This tab gives you the list of modes with the associated:
-
frequencies (Hz) for a Frequency Case and a Harmonic Dynamic Response Case
-
Buckling factor for a Buckling Case
- Time (s) for a Transient Dynamic Response Case
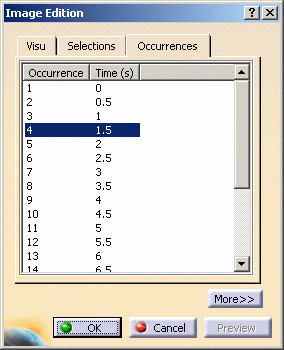
You can then activate separately each mode of the
multi-occurrence solution.
More and Less Buttons
For more details on Values and Filters options, click here.
Preview button
By default, the visualization process is launched after each modification in the Image Edition dialog box.
The Preview button allows you to launch the visualization process after performing all the needed changes in the Image Edition dialog box.
|
|
The Preview button is available only if you
deactivate the Automatic preview mode option in the Options
dialog box (Tools > Options... menu). |