|
If this option is selected (and the Display Tool Path
during Simulation option is selected), the TCP points are displayed.
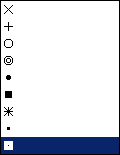
You can select the following display options for the points:
-
Color, which can be selected from the list
-
Type, which can selected from the list.

 By default, the options are as shown.
 |
|
If this option is selected (and the Display Tool Path
during Simulation option is selected), the tool path trace is
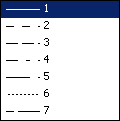
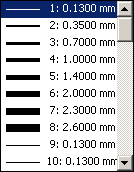
displayed as a line. You can select the following display options for
the line:
-
Color, which can be selected from the list
-
Type, which can selected from the list.

-
Line Thickness, which can be selected from the
list.

 By default, the options are as shown.
 |
![]()