General
- time spent in workbenches
- time spent using specific commands in those workbenches
- server statistics
- session statistics.
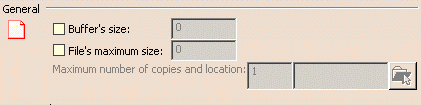
Buffer`s size
Size of buffer file in Kbytes. The log file is only written to disk once the log file size exceeds the buffer size you set. The values which can be entered in the editable field are limited. Buffer size is limited to 1024KB (1 MB). The values entered are in KB.
File's maximum size
Sets the maximum log file size. Each time this size is exceeded, the file is written to the location you specify by navigating using the file selection box in the Maximum number of copies and location option. The values which can be entered in the editable field are limited. The file size is limited to 2.097.152KB (2 GB).
Maximum number of copies and location
Sets the maximum number of copies of the statistics file, and the location in which the copies are stored on the disk. Once the size of the file exceeds the size set by the option File's maximum size, a copy of the file is written to the specified location. This helps to optimize disk space. Once the maximum number of copies is reached, the oldest log file is deleted.
The number of copies is limited to 999 (you can only enter 3 digits in the field).
Disk-Full Condition Management
The error logging software will detect disk-full conditions. If you set a maximum number of copies of the statistics file and a directory location to which copies are saved, the error logging software will move the file to the destination directory and try to continue logging. If you do not set a directory (or if after the copy the disk is still full), the error logging software will cease error logging until the end of the current session.
![]()
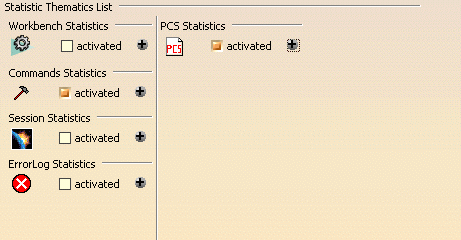
Statistic Thematics List
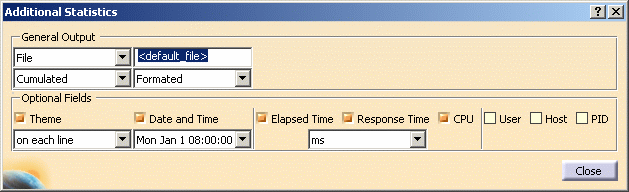
General Output

Basic statistics are common to all options. Error log statistics contain extra options.
There is a single log display mode:
- File: the log is written to the file whose default name is Workbench.log or Command when you exit the session, in the location pointed to by the CATErrorLog variable. Consequently, the files are written by default to:
CSIDL_LOCAL_APPDATA\DassaultSystemes\CATTemp\Statistics\Workbench.log

       CSIDL_LOCAL_APPDATA\DassaultSystemes\CATTemp\Statistics\Command.log
There are two log update modes:
- Cumulated: the log is written to the existing log
- Session: the existing log is overwritten by the log of the current session.
The log can be formatted or non-formatted.
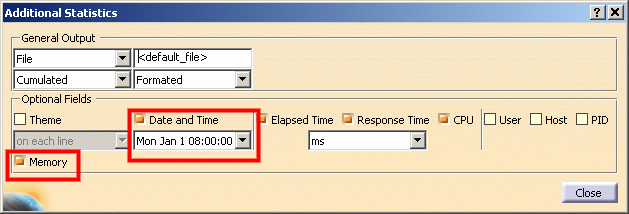
Optional Fields

This field contains the list of traditional statistics options: theme, date and time, elapsed time, response time, CPU, User, Host and PID.
Logging Workbench Activity
...them=WORKBENCH:time=Wed May 22
10.29.02 2002:elps=0.000000:rtim=0.000000:cpus=0.000000:Session=Start:User=SES:Host=JANEDSY
WORKBENCH: Wed May 22 10.38.57
2002:0.000000:0.000000:0.000000:Start:SES:JANEDSY
them=WORKBENCH:time=Wed May 22 10.39.32
2002:elps=5888.000000:rtim=861.000000:cpus=370.000000:Workbench=CATDrwDrwWkb:NLS=Drafting
them=WORKBENCH:time=Wed May 22 10.39.38
2002:elps=3213621.000000:rtim=901.000000:cpus=170.000000:Workbench=CATPstProductWkb:NLS=
Product Structure
them=WORKBENCH:time=Wed May 22 11.33.12
2002:elps=4567.000000:rtim=270.000000:cpus=130.000000:Workbench=CATCuiCATALOGWks:NLS=Catalog
Editor
them=WORKBENCH:time=Wed May 22 11.33.16
2002:elps=3866.000000:rtim=100.000000:cpus=60.000000:Workbench=CATMaterialWorkshopWks:NLS=
Material Library
them=WORKBENCH:time=Wed May 22 11.33.20
2002:elps=3585.000000:rtim=100.000000:cpus=90.000000:Workbench=CATAifAssemblyWkb:NLS=Assembly
Design
them=WORKBENCH:time=Wed May 22 11.33.24
2002:elps=50.000000:rtim=50.000000:cpus=40.000000:Workbench=CATMaterialWorkshopWks:NLS=Material
Library
them=WORKBENCH:time=Wed May 22 11.33.24
2002:elps=40.000000:rtim=40.000000:cpus=30.000000:Workbench=CATCuiCATALOGWks:NLS=Catalog
Editor
them=WORKBENCH:time=Wed May 22 11.33.24
2002:elps=1833.000000:rtim=120.000000:cpus=110.000000:Workbench=CATAifAssemblyWkb:NLS=Assembly
Design
     WORKBENCH:Wed May 22 11.36.17
     2002:48690.000000:341.000000:300.000000:Workbench=CATAifAssemblyWkb:NLS=Assembly
     Design

     WORKBENCH:Wed May 22 11.37.06
     2002:2173.000000:481.000000:290.000000:CATPstProductWkb:Product Structure

     WORKBENCH:Wed May 22 11.37.08
     2002:11517.000000:1832.000000:1451.000000:CATPcfPartWkb:Part Design

     WORKBENCH:Wed May 22 11.37.21
     2002:4877.000000:471.000000:430.000000:CATDrwDrwWkb:Drafting

     WORKBENCH:Wed May 22 11.37.26
     2002:4747.000000:491.000000:120.000000:CATHybridPartWorkbenchWkb:Hybrid
     Part Workbench

     WORKBENCH:Wed May 22 11.37.31
     2002:50.000000:50.000000:30.000000:CATDrwDrwWkb:Drafting

     WORKBENCH:Wed May 22 11.37.31
     2002:1292.000000:70.000000:60.000000:CATHybridPartWorkbenchWkb:Hybrid Part
     Workbench
- Workbench = internal workbench name
- NLS = NLS name of the workbench (the name which appears in the Start menu).
When you change an option, exit the session and restart to take your settings into account.
Logging Command Activity
them=COMMAND:time=Wed
     May 22 10.05.17 2002:elps=8993.000000:rtim=7491.000000:cpus=630.000000:Command=FileNew:NLS=New...:CurrentWorkbench=CATPstProductWkb:NLS_CurrentWorkbench=

     Product Structure:Origin_Header=Global:mode=ForegroundCmd
where:
them: theme (command in this case)
time: time
elps: elapsed time spent in the command.
rtim: "response time", which is the ellapsed time minus user wait time.
Cpus: cpu time spent is the command.
Command: internal command name
NLS: external command name
CurrentWorkbench: internal current workbench name
NLS_CurrentWorkbench: external current workbench name
Origin_Header: origin header
mode: background or foreground mode.
This trace will be logged when you exit the command. The workbench name is the current workbench when you exit the command.
Note that certain auxiliary commands (for example, the Search command) are not logged.
Example of formatted traces for a command log
them=COMMAND:time=Fri Jan 21 14.44.36
     2005:elps=0.000000:rtim=0.000000:cpus=0.000000:user=ses:host=JANE2DSY:upid=3168:Session=Start

     them=COMMAND:time=Fri Jan 21 14.44.43
     2005:elps=3828.000000:rtim=94.000000:cpus=76.000000:user=ses:host=JANE2DSY:upid=3168:Command=FileNew:NLS=New...:CurrentWorkbench=CATPstProductWkb:NLS_CurrentWorkbench=Product
     Structure:Origin_Header=Global:mode=ForegroundCmd

     them=COMMAND:time=Fri Jan 21 14.44.36
     2005:elps=11219.000000:rtim=16.000000:cpus=15.000000:user=ses:host=JANE2DSY:upid=3168:Command=Select:NLS=Select:CurrentWorkbench=CATPstProductWkb:NLS_CurrentWorkbench=Product
     Structure:Origin_Header=Global:mode=ForegroundCmd

     them=COMMAND:time=Fri Jan 21 14.44.50
     2005:elps=6671.000000:rtim=5234.000000:cpus=406.000000:user=ses:host=JANE2DSY:upid=3168:Command=FileNew:NLS=New...:CurrentWorkbench=CATPstProductWkb:NLS_CurrentWorkbench=Product
     Structure:Origin_Header=Global:mode=ForegroundCmd

     them=COMMAND:time=Fri Jan 21 14.45.01
     2005:elps=15343.000000:rtim=15.000000:cpus=0.000000:user=ses:host=JANE2DSY:upid=3168:Command=Select:NLS=Select:CurrentWorkbench=CATPcfPartWkb:NLS_CurrentWorkbench=Part
     Design:Origin_Header=Global:mode=ForegroundCmd

     them=COMMAND:time=Fri Jan 21 14.45.16
     2005:elps=20313.000000:rtim=110.000000:cpus=106.000000:user=ses:host=JANE2DSY:upid=3168:Command=OpenSettings:NLS=Options...:CurrentWorkbench=CATPcfPartWkb:NLS_CurrentWorkbench=Part
     Design:Origin_Header=Global:mode=ForegroundCmd

     them=COMMAND:time=Fri Jan 21 14.45.36
     2005:elps=3265.000000:rtim=15.000000:cpus=15.000000:user=ses:host=JANE2DSY:upid=3168:Command=Select:NLS=Select:CurrentWorkbench=CATPcfPartWkb:NLS_CurrentWorkbench=Part
     Design:Origin_Header=Global:mode=ForegroundCmd

     them=COMMAND:time=Fri Jan 21 14.44.47
     2005:elps=52641.000000:rtim=2281.000000:cpus=416.000000:user=ses:host=JANE2DSY:upid=3168:Command=Select:NLS=Select:CurrentWorkbench=CATPstProductWkb:NLS_CurrentWorkbench=Product
     Structure:Origin_Header=Global:mode=ForegroundCmd

     them=COMMAND:time=Fri Jan 21 14.45.40
     2005:elps=78.000000:rtim=62.000000:cpus=62.000000:user=ses:host=JANE2DSY:upid=3168:Command=FileExit:NLS=Exit:CurrentWorkbench=CATPcfPartWkb:NLS_CurrentWorkbench=Part
     Design:Origin_Header=Global:mode=ForegroundCmd

     them=COMMAND:time=Fri Jan 21 14.44.36
     2005:elps=64094.000000:rtim=7641.000000:cpus=946.000000:user=ses:host=JANE2DSY:upid=3168:Session=End
Example of non-formatted traces for a workbench log
COMMAND:Wed May 22 10.29.14
     2002:7051.000000:171.000000:160.000000:Command=OpenSettings:NLS=Options...:CurrentWorkbench=CATAifAssemblyWkb:NLS_CurrentWorkbench=

     Assembly Design:Origin_Header=Global:mode=ForegroundCmd

     COMMAND:Wed May 22 10.29.21
     2002:2673.000000:30.000000:30.000000:Select:Select:CATAifAssemblyWkb:Assembly
     Design:Global:ForegroundCmd

     COMMAND:Wed May 22 10.29.24
     2002:1392.000000:31.000000:30.000000:PasteSpecial:Paste Special...:CATAifAssemblyWkb:Assembly
     Design:Global:

     ForegroundCmd

     COMMAND:Wed May 22 10.29.25
     2002:2003.000000:21.000000:10.000000:Select:Select:CATAifAssemblyWkb:Assembly
     Design:Global:ForegroundCmd

     COMMAND:Wed May 22 10.29.00 2002:27429.000000:70.000000:10.000000:Command=AnalyserCmd:NLS=AnalyserCmd:Origin_Header=Global:mode=

     BackgroundCmd

     COMMAND:Wed May 22 10.29.27
     2002:50.000000:50.000000:40.000000:FileExit:Exit:CATAifAssemblyWkb:Assembly
     Design:Global:ForegroundCmd
Logging Session Statistics
This information is limited to one event per session.
As such, it will help keep track of users' session durations and ending status, providing a supplementary tool to measure MTBF.
CATTemp/Statistics/Stats_SESSION_user_HOST
Example of output:
them=SESSION:time=Mon Apr 14 09.12.06 2003:elps=131690.000000:
rtim=1112.000000:cpus=110.000000:MainName=CATIA:ExitStatus=normal_end
No output is generated for the session during which the session statistics are activated. You have to exit then restart your Version 5 session, and from then on you will obtain session statistics output for all further sessions.
This new functionality is mainly useful for Version 5 administrators. Session Statistics list all the sessions, their duration, and exit conditions for any or all users, easily providing them with a comprehensive view of the average duration of user sessions and allows a global view of the usage of Version 5 by any user or group of users.
It also provides an idea of the percentage of sessions where no failure occurred.
Session statistics add a global view in addition to the more detailed views already provided by the existing COMMAND and WORKBENCH statistics.
Notes about output logs
Event dates in the output file are not organized in chronological order. A statistics event is always logged when it is terminated. The start date and duration are specified. Events are generated in event termination chronological order. Because the statistics software allows interlaced or embedded events, events do not necessarily end in the order in which they began.
The two start and end slots indicate the same time. A statistics event is always logged when it is terminated. The start time and duration are specified. The corresponding session event is generated at the end of the session: it started at the beginning of the session and lasts the duration of the session. Due to the possibility of having several successive session statistics in the same session, it is necessary to physically log the start of a session. This is the session start event (whose duration is null). The two events are generated at the same time in the code. To determine the end time, information is provided for the start date and duration.
![]()
Error Logging Capability
The objective of this feature is to provide a key tool for MTBD tracking.
It will enable to users to detect hidden problems or find areas where improvement should be done, in terms of quality and functionality. Not only failure will be logged but also defects which may cause any sort of problems to the end-user. Typically, it will log pop-up warnings, internal critical errors and failures.
Furthermore, end-users have a user interface allowing them to report defects and describe the problem. This report will be logged in this error log.
Principal Features
- Tools options user interface to activate/customize the error log
- user interface allowing user to report error logging
- logging of all infrastructure warning popups
- logging of all abends/failures
- logging of main applicative popups
- logging of critical internal errors.
Activating the Error Log
- To activate the option, check the "activated" option.
- Click the "+" button to access a dialog box containing more advanced
customization options.
Note that the additional statistics contain extra options for error logging:
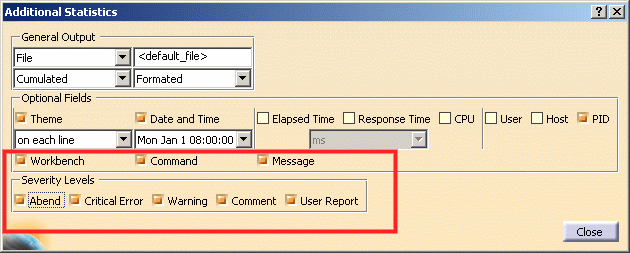
Description of Error Log Scope
Optional Fields contains the following three options specific to error logging:
- Workbench
- Command
- Message
enabling you to specify whether you want to log workbench, command or message activity respectively. When activated, an error log will be generated. This error log contains one line per event. Each event will correspond to a defect.
Severity Levels
![]()
The defects may be:
- an abend or failure
- a critical internal error detected by a low layer of the application and which may potentially cause later defects
- a warning pop-up displayed to the end-user
- a comment (indicating surprising or bothersome behavior which is not a defect, for example
- a user-reported defect.
Error Log Record Format
The error log uses the V5 statistics format. The default record format
is:
| Log Field | Present/Absent in Default Log | Comment |
| Thematic Name | Present | may be discarded by administrator |
| Date/Time of the error | Present | may be discarded by administrator |
| User ID (Windows) | Present | may be discarded by administrator |
| Host ID | Absent | may be added by administrator |
| Process ID | Absent | may be added by administrator |
| Date/Time of command start | Present | may be discarded by administrator |
| Workbench Name | Present | may be discarded by administrator |
| Command Name | Present | may be discarded by administrator |
| Error/Warning Message Code | Present | mandatory |
| Message Text | Present | depends on Error Log option |
1st format style (with field names)
them=ErrorLog:time=Mon Apr 14 09.12.06
     2003:user=SGT:Workbench=CATPstProductWkb: Command=Select:gravity=warning:msg="Update
     Error"
2nd format style (without field names)
ErrorLog:Mon Apr 14 09.12.06
     2003:SGT:CATPstProductWkb:Select:warning:"Update
     Error"
Note: Administrators will be able to lock these settings so that the end-user cannot change them, in which case an end-user will not be able to deactivate error logging.
User Defect Reporting
You can add your own information to the log by checking the User Report option. When you do so, you need to access the Error Log dialog box. To do so:
- Select the View->Toolbars command.
- Select the Error Log toolbar.
The toolbar is displayed. - Select the Error Log toolbar to display the Error Log dialog box:
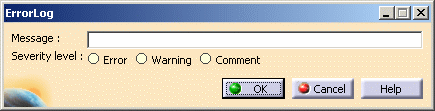
- Perform a scenario in which you observe a problem which has surprising or bothersome behavior and which is not a defect.
- Specify the severity level and enter a comment in the Message field to describe the problem.
- Exit your Version 5 session.
Location of Error Log
The log is located in the location referenced by the CATTemp variable. For example, the default location (on Windows) of the error log is:
C:\Documents and Settings\user\Local
     Settings\Application Data\DassaultSystemes\CATTemp\Statistics
Logging PCS Traces
System PCS (performance, capacity and scalability) traces have been provided to be able to measure CPU and memory consumption in client and server scenarios for CATIA, ENOVIA and VPMV5 applications.
This tool is designed to:
- determine the main PCS costs of a scenario
- identify the critical points for PCS problems
- obtain customer site PCS information about critical problems without needing too much or confidential data.
A typical scenario for which this tool would be useful is the use of the VPM Nav command in CATIA to open a product root class (PRC) on an ENOVIA V5 server.
This new functionality will provide PCS administrators with more accurate data about memory and CPU use during each step of a scenario.
Note: only client PCS traces are supported in this release.
Functionalities
PCS Statistics allow users to log events and obtain information about CPU and memory consumption during the event.
The PCS thematic has several activation levels. The end user can choose the level of details required for measurements.
Only the event with an activation level less or equal than the activated level are output (more macroscopic events have a lesser activation level.)
This allows you to begin a statistics analysis session by identifying the macro events where a performance problem occurs, then to go gradually to the details to identify the exact layer of software which is causing the problem.
The PCS thematic has a specific option call cumulated stats:
- this option cumulates all the occurrences of the same type (sum of elapsed time, cpu time).
- only one line is generated in the output file: a field in the output specifies the number of cumulated events.
- it is possible to simultaneously have cumulated events and individual
events, depending on their respective levels:
1 < activation level of the event <= selected cumulation
         level
: one line is generated by eventcumulation level < activation level of the event <=selected activation level: one line is generated per group of events.
This allows analysis of individual macroscopic events and how their time is divided, without having hundreds of microscopic sub-events.
A command has been provided to define dynamically the start and end of the measurement. Contrary to most other statistics, PCS statistics are meant to be used dynamically PCS statistics are activated by default, but no events will be generated if the user does not specify at least an activation level (cumulation level is optional).
An extra field exists for the memory (start memory and end memory; current memory or last recorded peak, depending on the operating system).
Unlike other statistics, the date parameter provides beginning and end time.
Activating PCS Statistics
The PCS Statistics thematic is activated by default in the Statistics Thematics List.
PCS has a new optional field: Memory.
When activated, it generates two fields in the output file:
- memory at the beginning
- and memory at the end
of the statistics event. Depending on the operating system, the value can be the instant memory or the last peak value.
Contrary to all other statistics thematics, when activated, the time field generate two fields in the output file, the date and time:
- at the beginning of the event
- and also at the end.
Activation Level
It comprises up to ten activation levels.
Select the View->Toolbars command and check PCS Statistics to display the following toolbar:
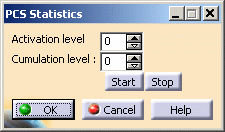
By default, the level is set to "0", which means no traces are generated. Use the Start and Stop buttons to start and stop PCS measuring.
Cumulation Level
This option can be used to condense several events into a single generated line. This provides cpu time, cumulated elapsed times, and an extra field providing the number of iterations.
By default, the cumulation level mode is set to "0", so it is inactive.
If "n" and "m" are event levels:
o<n< cumulation level < m< activation level
An event of level "n" will be detailed (1 line per event).
An event of level "m" will be cumulative (1 line for one or more events).
If you set a cumulation level higher than the activation level, the cumulation level will be set equal to the activation level.
Example of output
Example of generated line:
them=PCS:time=Wed Jul 07 16.46.46 2004:end_time = Wed Jul 07
     16.46.46 2004 :elps=0.000000:rtim=0.000000:cpus=0.000000

     :user=siu:host=DREX1DSY:upid=2756:start_max=15705112:
     Field1=Value1:Field2=Value2:end_max=1244964
Limitations
To generate an output, two conditions must be fulfilled:
- PCS Thematics must be activated: if not, an error message appears in the PCS panel, and measurement can not start. Furthermore, the activation level of the statistics event must be less than or equal to the level activated in the PCS panel: if not, nothing is output, and no error message appears.
- Depending on the operating system, the names of the values provided
for memory usage vary:
- the value of the current memory: the field names in the output file are "start_mem" and "end_mem"
- the value of the latest memory peak (in this case, the value can only increase during the session): the fields in the output file are "start_max" and "end_max".
![]()