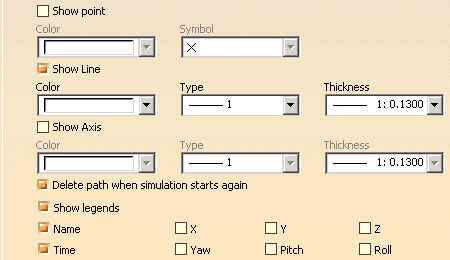
Simulation Trace Options
|
|

|
Show Point
|
| Provides the color and symbol for each point within a simulation trace,
if the Show point option is enabled.
 The
default value for the Show point option is off; the initial
appearance settings for points are shown above. The
default value for the Show point option is off; the initial
appearance settings for points are shown above. |
Show Line
|
| Provides the color, type of line, and line thickness for each
simulation trace, if the Show line option is enabled.
 The
default value for the Show line option is on; the initial
appearance settings for lines are shown above The
default value for the Show line option is on; the initial
appearance settings for lines are shown above |
Show Axis
|
| Provides the color, line type, and thickness for the axis of each
simulation trace, if the Show axis option is enabled.
 The
default value for the Show axis option is off; the initial
appearance settings for axes are shown above. The
default value for the Show axis option is off; the initial
appearance settings for axes are shown above. |
Delete path when simulation starts again
|
| This option means that each simulation's path will deleted when a new
simulation is run. Otherwise, each path will remain visible until the
session ends. The setting here can be overridden on the Simulation Trace
dialog box.
 The
default value for this option is on. The
default value for this option is on. |
Show legends
|
Text appears when a point/line/axis is (pre)selected by the user. The
text contains information related to the current point. The text can
contain any of the following data (if selected):
- Name
- Time
- X axis
- Y axis
- Z axis
- Yaw
- Pitch
- Roll
 The
default value for these options is that Name and Time
are selected. The
default value for these options is that Name and Time
are selected. |
 |
![]()