The remote asynchronous node (RAN) is equipped with:
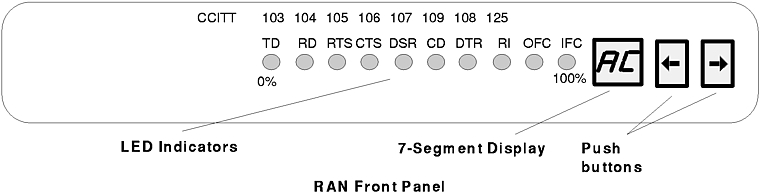
The following figure shows the front panel of the EIA 232 RAN.
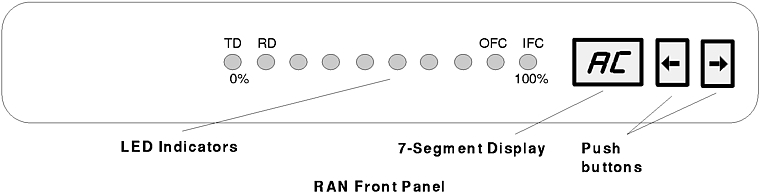
The following figure shows the front panel of the EIA 422 RAN.
The LED indicators can be used to reflect the activity of each of the EIA 232 lines and flow control status for a given line. They can also be set to act as a bar graph to show CPU utilization and the activity level of the EIA 422 synchronous line.
The RAN front panel display has several different display modes as indicated by the two-digit, seven-segment display. Pushing the Right or Left arrow push buttons will cycle the display sequentially through the modes.
The following table describes the RAN display modes.
| RAN Display Modes | |||||
| Mode | Mode Name | Description | |||
| P1 | POST Complete | P1 appears on the seven-segment display. Power-on self-test is complete, relays are open waiting for connection. | |||
| P2 | Ping Packet Receive | P2 appears on the seven-segment display. Indicates that the operating system successfully transmitted a ping packet to RAN. The ping packet contains configuration information used by the RAN (for example baud rate, type of interface). | |||
| P3 | Transmit Configuration Packet | P3 is not displayed on the seven-segment display. The RAN transmits a packet that contains information about the RAN's physical characteristics. The operating system uses this information to determine which download image to send to the RAN. The RAN does not receive confirmation that the operating system has received the packet. | |||
| P4 | Image Receive | P4 appears on the seven-segment display. Download image is being received from the host. The RAN will normally stay at P4 for a length of time, depending on the synchronous baud rate being used. | |||
| AC | Activity | AC appears on the seven-segment display. The 10 LEDs turn on sequentially from left to right. The speed of this "chase light" display increases with the overall activity level of the RAN. | |||
| 00-15 | Line Monitor | 00-15 appears on the seven-segment display. Modes 00 through 15 correspond to channels 0 through 15. Press the right or left push buttons until the desired channel number appears in the seven-segment display. The LEDs act as line monitor for the selected channel. The first eight LED indicators show the activity of each of the eight EIA 232 signals (TD, RD, RTS, CTS, DSR, DCD, DTR, and RI). The last two LED indicators show when output flow control (OFC) and input flow control (IFC) are active. | |||
| En | Error Node | En appears on the seven-segment display. Indicates that a valid ping packet was received but the node number in EEPROM is incorrect. | |||
| PC | Packet Count | PC appears on the seven-segment display. The 10 LEDs show a binary representation of the total number of packets transmitted or received. Pressing both push buttons simultaneously resets the count to 0. | |||
| EC | Error Count | EC appears on the seven-segment display. The 10 LEDs show a binary representation of the total number of errors counted in the data. Pressing both push buttons simultaneously resets the count to 0. | |||
When the EC counter is rapidly increasing, this is often an indicator that:
| |||||
| PU | Processor Utilization | PU appears on the seven-segment display. The 10 LEDs become a bar graph indicating the percentage (0-100%) of the time the RAN microprocessor is being used. | |||
| LU | Line Utilization | LU appears on the seven-segment display. The 10 LEDs become a bar graph indicating the percentage (0-100%) of the time that the synchronous communications line is being used. | |||
| 1n, 2n,...,8n * | Node Number | The seven-segment display shows the node number of the RAN. | |||
| Ed | POST Error Diagnostics | Fatal POST Error. RAN will stay isolated from host. | |||
Note: * Only node numbers 1n through 4n are valid. Node numbers 5n through 8n are not supported.