-
Click the Highlight Lines Analysis icon
 .
.
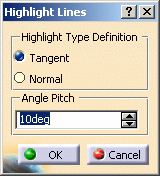
The Highlight Lines dialog box opens.
-
Select one or more surfaces to be analyzed.
-
Select the highlight type:
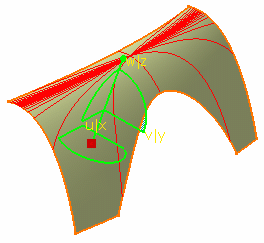
Tangent: the compass plane intersects the surface at a given point. Then the tangent to this intersection is calculated.
Therefore, the angle should be computed between the first direction of the compass and the tangent to the intersection.The tangent in each point of the created line is defined through rotations of the angle pitch.
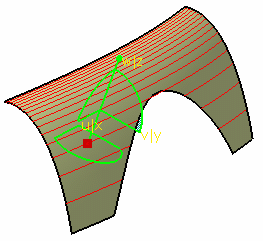
Normal: the angle should be computed between the Z compass direction and the normal to the surface.
The normal to the surface in each point of the created line has the same angle pitch in a specified direction.
-
Keep this highlight line
-
Keep all highlight lines
The created curve(s) appears in the specification tree as a datum element.
-
Key in an angle, representing the value between the selected direction and the normal or tangent to the surface.
-
Click OK when you have finished the analysis.
The analysis (identified as Highlight Lines Analysis.x) is added to the specification tree.
![]()


