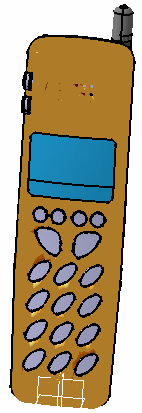
It consists of four clouds of points:
- a mesh,
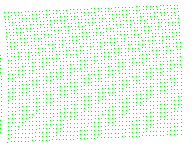
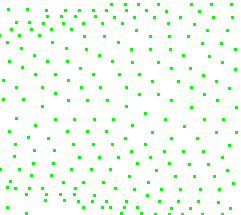
- a cloud of points,
- a set of scans,
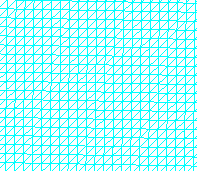
- a set of grids.
- orange,
- green,
- cyan,
- cyan.
Further graphic properties are available from the Edit/Properties menu, in the Graphic tab.
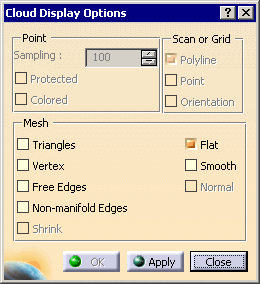
From the Cloud Display Options box, you can:
- Choose the sampling of clouds of points (N of 100 points are displayed).
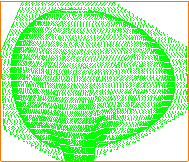
- Choose to display scans or grids as polylines, points, or both.
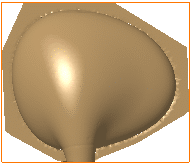
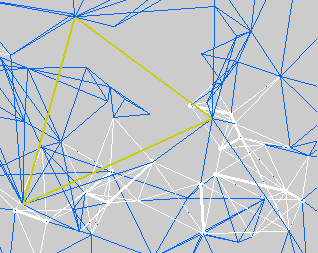
- Choose to display triangles, free edges, non-manifold edges of meshes.
You can also choose their display mode: flat or smooth.
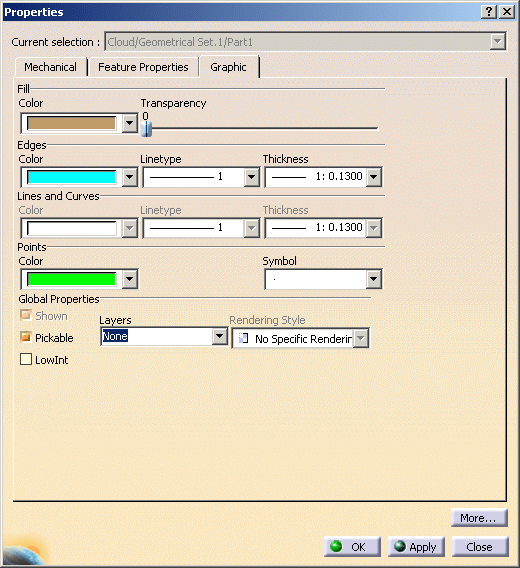
From the Edit/Properties menu, you can:
- Choose the fill color of the mesh and its transparency level,
- Choose the color and symbol of the points of a cloud,
- Choose the color, type and thickness of scans and grids,
- Choose to elements pickable or not.
Cloud Display Options
The images below are only examples.
-
Click Cloud Display Options
 at the bottom of the screen.
The Cloud Display Options dialog box is displayed.
-
Select the cloud to modify. Display options are proposed according to the type of the cloud selected:

Following options are not yet available: - Protected,
- Orientation,
- Shrink,
- Normal.
-
Select display options:
-
if you activate only a portion of a cloud of points, the free edges of that portion are not displayed.

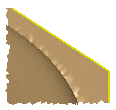
- if you remove a portion of a cloud of points, the free edges of the
remaining portion are displayed.

- If you move a cloud of points or a mesh, its graphic display options (not the graphic properties) are lost.
- The display options are not saved in the CATPart while the graphic properties are.
Edit/Properties menu (Graphic tab)
For more information about this menu, please refer to the Displaying and
Editing Graphic Properties
chapter in the CATIA Infrastructure user's guide.
The images below are only examples.
or display the Graphic Properties toolbar (View>Toolbars>Graphic Properties).
or

- The color displayed in the Graphic Properties toolbar applies to meshes only.
- The graphic properties are saved in the CATPart.
- Use Fill>Color and Transparency to modify the color and transparency of meshs:
![]()

- the color of mesh free edges is yellow, and is not editable,
- the color of non-manifold edges is white, and is not editable,
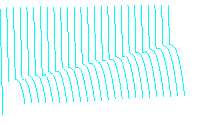
- the default color of scans has changed to cyan.
For a higher transparency quality, go to Tools>Options>Display>Performances and check the High (Alpha blending) option.
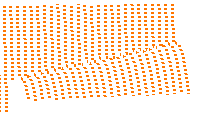
- Use Edges>Color, Line type and Thickness
to modify the display of scans and grids or of the triangles of a mesh:

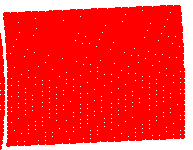
- Use Points>Color and Symbol to modify the
display of clouds of points:

- Use the Pickable check box to make an element pickable or not, and choose the pick option in the list below.
![]()


 instead of
 or
or
