![]()
This task shows you how to export both 3D and 2D inertia results to a text file.
![]()
Insert the Body1.cgr and the Body2.cgr documents.
They are to be found in the online documentation file tree
in the common functionalities samples folder cfysm/samples
-
Select the root product and click the Measure Inertia icon. The dialog box expands to display the results for the selected item.
-
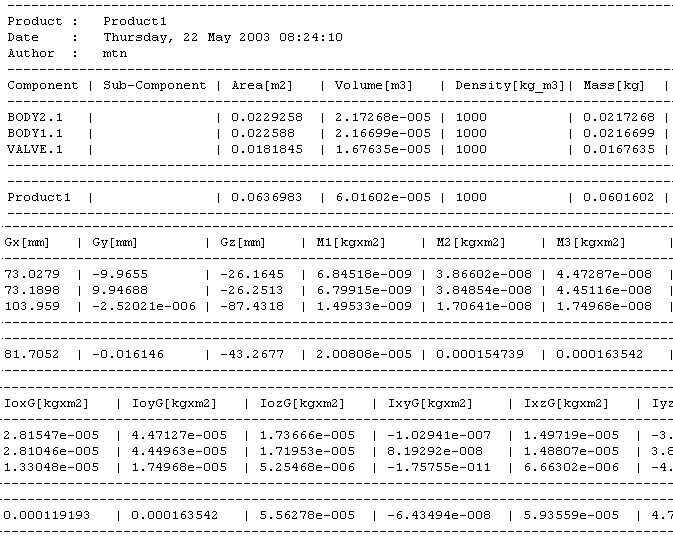
Click Export to write the results to a text (*.txt) file.

Results shown in the Measure Inertia dialog box only are exported. Exported results are given in current units.
-
Identify the file name and location in the Export Results dialog box that appears, then click Save.

Notes:
-
The examples given below concern 3D inertia results.
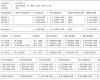
If an assembly comprises sub-products or a part comprises part bodies, individual results for all sub-products or part bodies are also exported and written to the text file. 
-
-
If the principal axes A are exported, bounding box values are also exported.
where BBOx,y,z defines the origin and BBLx,y,z the length along the corresponding axis.
Note: When importing the text file into an Excel spreadsheet, do not forget to identify the pipe character (|) used as separator in the Text Import Wizard dialog box.

![]()