It analyses the angle between surface normals and a predefined direction. Dependent on the angle, it sets the color at this surface position. All positions with the same angle between surface normal and predefined direction get the same shading color. If the angle is 90 degrees, the resulting stripe is the silhouette line related to the predefined direction.
Open the FreeStyle_13.CATPart document:
-
Make sure the Material visualization option is active in the View > Render Style > Customize View command to be able to see the analysis results on the selected element. Otherwise a warning is issued.
The Highlights dialog box opens.
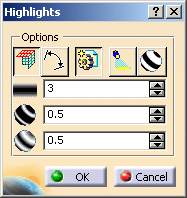
You do not need to select the part in the specification tree as the analysis works globally on the part.
-
Define the display options:
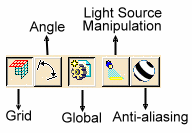
-
Grid: two predefined directions define a grid of stripes (not necessarily perpendicular) on the surface. The plane tool u and v direction, are used as predefined directions in grid mode. If you uncheck the Grid options, it switches to the Stripes mode: the plane tool normal is the predefined direction.
-
Angle: highlights are distributed per angle.
-
Global: the whole part is highlighted.
-
Light Source Manipulation: opens the Light Source Manipulation dialog box to let you manipulate light. sources
-
Anti-aliasing: stripes appear smoother.

-
Density: defines the number of stripes or grid lines.
-
Thickness: defines the thickness of stripes or grid lines.
-
Sharpness: defines the sharpness of stripes or grid lines (soft or hard color transition).
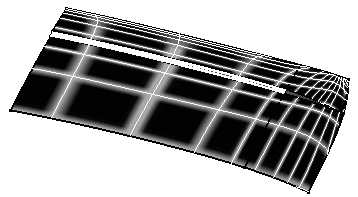
Here is an example with the following values:
Grid and Global
Density=50
Thickness=0.30
Sharpness=0.80
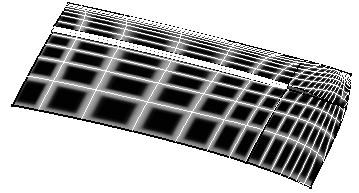
Here is an example with the following values:
Grid and Global
Density=80
Thickness=0.70
Sharpness=0.30
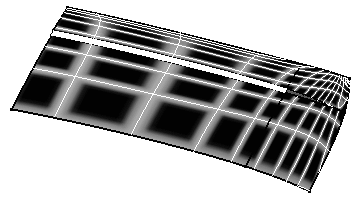
Here is an example with the following values:
Grid, Global, and Angle
Density=80
Thickness=0.70
Sharpness=0.30
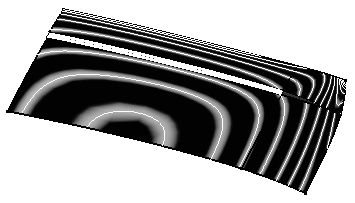
Here is an example with the following values:
Global and Angle
Density=80
Thickness=0.70
Sharpness=0.30
-
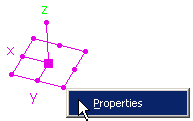
Right-click the plane tool to display the Highlights Properties.
-
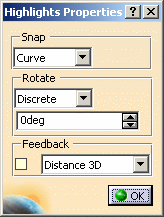
Define the snap mode to snap tool position and optionally orientation on geometry
-
Off: no snap mode
-
Vertex: the plane tool snaps on a vertex. Dependent on the vertex (surface corner, 3D curve endpoint), the direction is adapted to the surface normal or curve tangent
-
Curve: the plane tool snaps on a curve or surface edge. As a result in stripes mode the silhouette line of the plane tool normal crosses the edge at the plane tool origin
-
Surface: the plane tool snaps on a surface and adapts the surface normal. As a result in grid mode the silhouette line of the plane tool u direction and the silhouette line of the plane tool v direction are crossing at the plane tool origin
-
-
Define the rotation mode of the 3D tool:
-
Dynamic: normal dynamic rotation mode
-
Discrete: the rotation of the tool snaps to certain relative grid angles.
-
Grid: the rotation of the tool snaps to certain absolute grid angles.
-
Static: the rotation is activated by a mouse click on the corresponding rotation handle of the tool. The grid value defines the specific rotation angle
-
-
Define the rotation value by entering a value or using the spinners
-
Define the numerical feedback of the 3D tool:
-
Distance 3D: direct distance between the start position of the translation and the current position
-
Distance XYZ: distance shown in x, y and z components of the current coordinate system
-
Coordinates: absolute position of the tool in the model coordinate system
-
-
Click OK to create the analysis.