-
In the power input box, enter the following command:
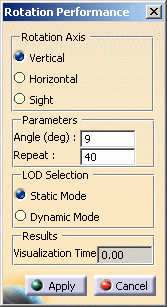
c:TestVisuPerfoDrawThe Rotation Performance dialog box opens: 
-
In the Rotate Axis area, select the desired rotation axis by clicking the appropriate option:
- Vertical: corresponds to the default axis which is vertical and parallel to the screen
- Horizontal: corresponds to the horizontal axis, parallel to the screen
- Sight: corresponds to the axis which is perpendicular to the screen.
-
In the Parameters area, you need to define:
- the angle for each rotation step (in degrees) in the Angle box
- the number of steps in the Repeat box.
-
In the LOD Selection area, select the desired level of details:
- Static Mode
- Dynamic Mode.
Depending on the mode you select, the test is performed according to the value you set in Level of Details area available in Tools > Options > General > Display > Performance:
- selecting Static Mode means that the test is performed using the value set with the Static slider.
- selecting Dynamic Mode means that the value used for the test is the one defined with the While Moving slider.
-
Click Apply to start testing.
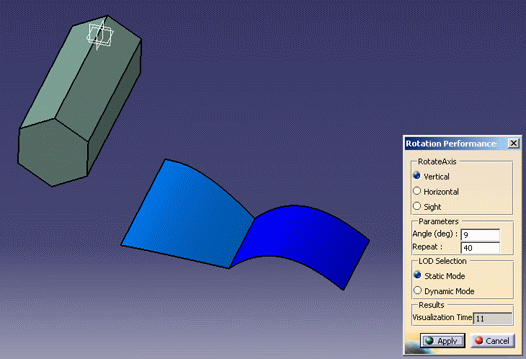
The parameters you defined are applied and the corresponding result performance is displayed in the Visualization Time box as shown below:

The time displayed corresponds to the average visualization time per frame (in milliseconds). This average value is computed as follows: for instance, if you display 40 times your model (whatever the Angle value), the average visualization time will be the total visualization time (i.e. is the sum of all milliseconds spent to draw the 40 frames) divided by 40.
The total visualization time is not displayed in this dialog box but you can compute it very easily. To do so, multiply the value displayed in the Visualization Time box by the value displayed in the Repeat box. -
Click Close to exit the command.
![]()